Presenting data and insights in industry reports
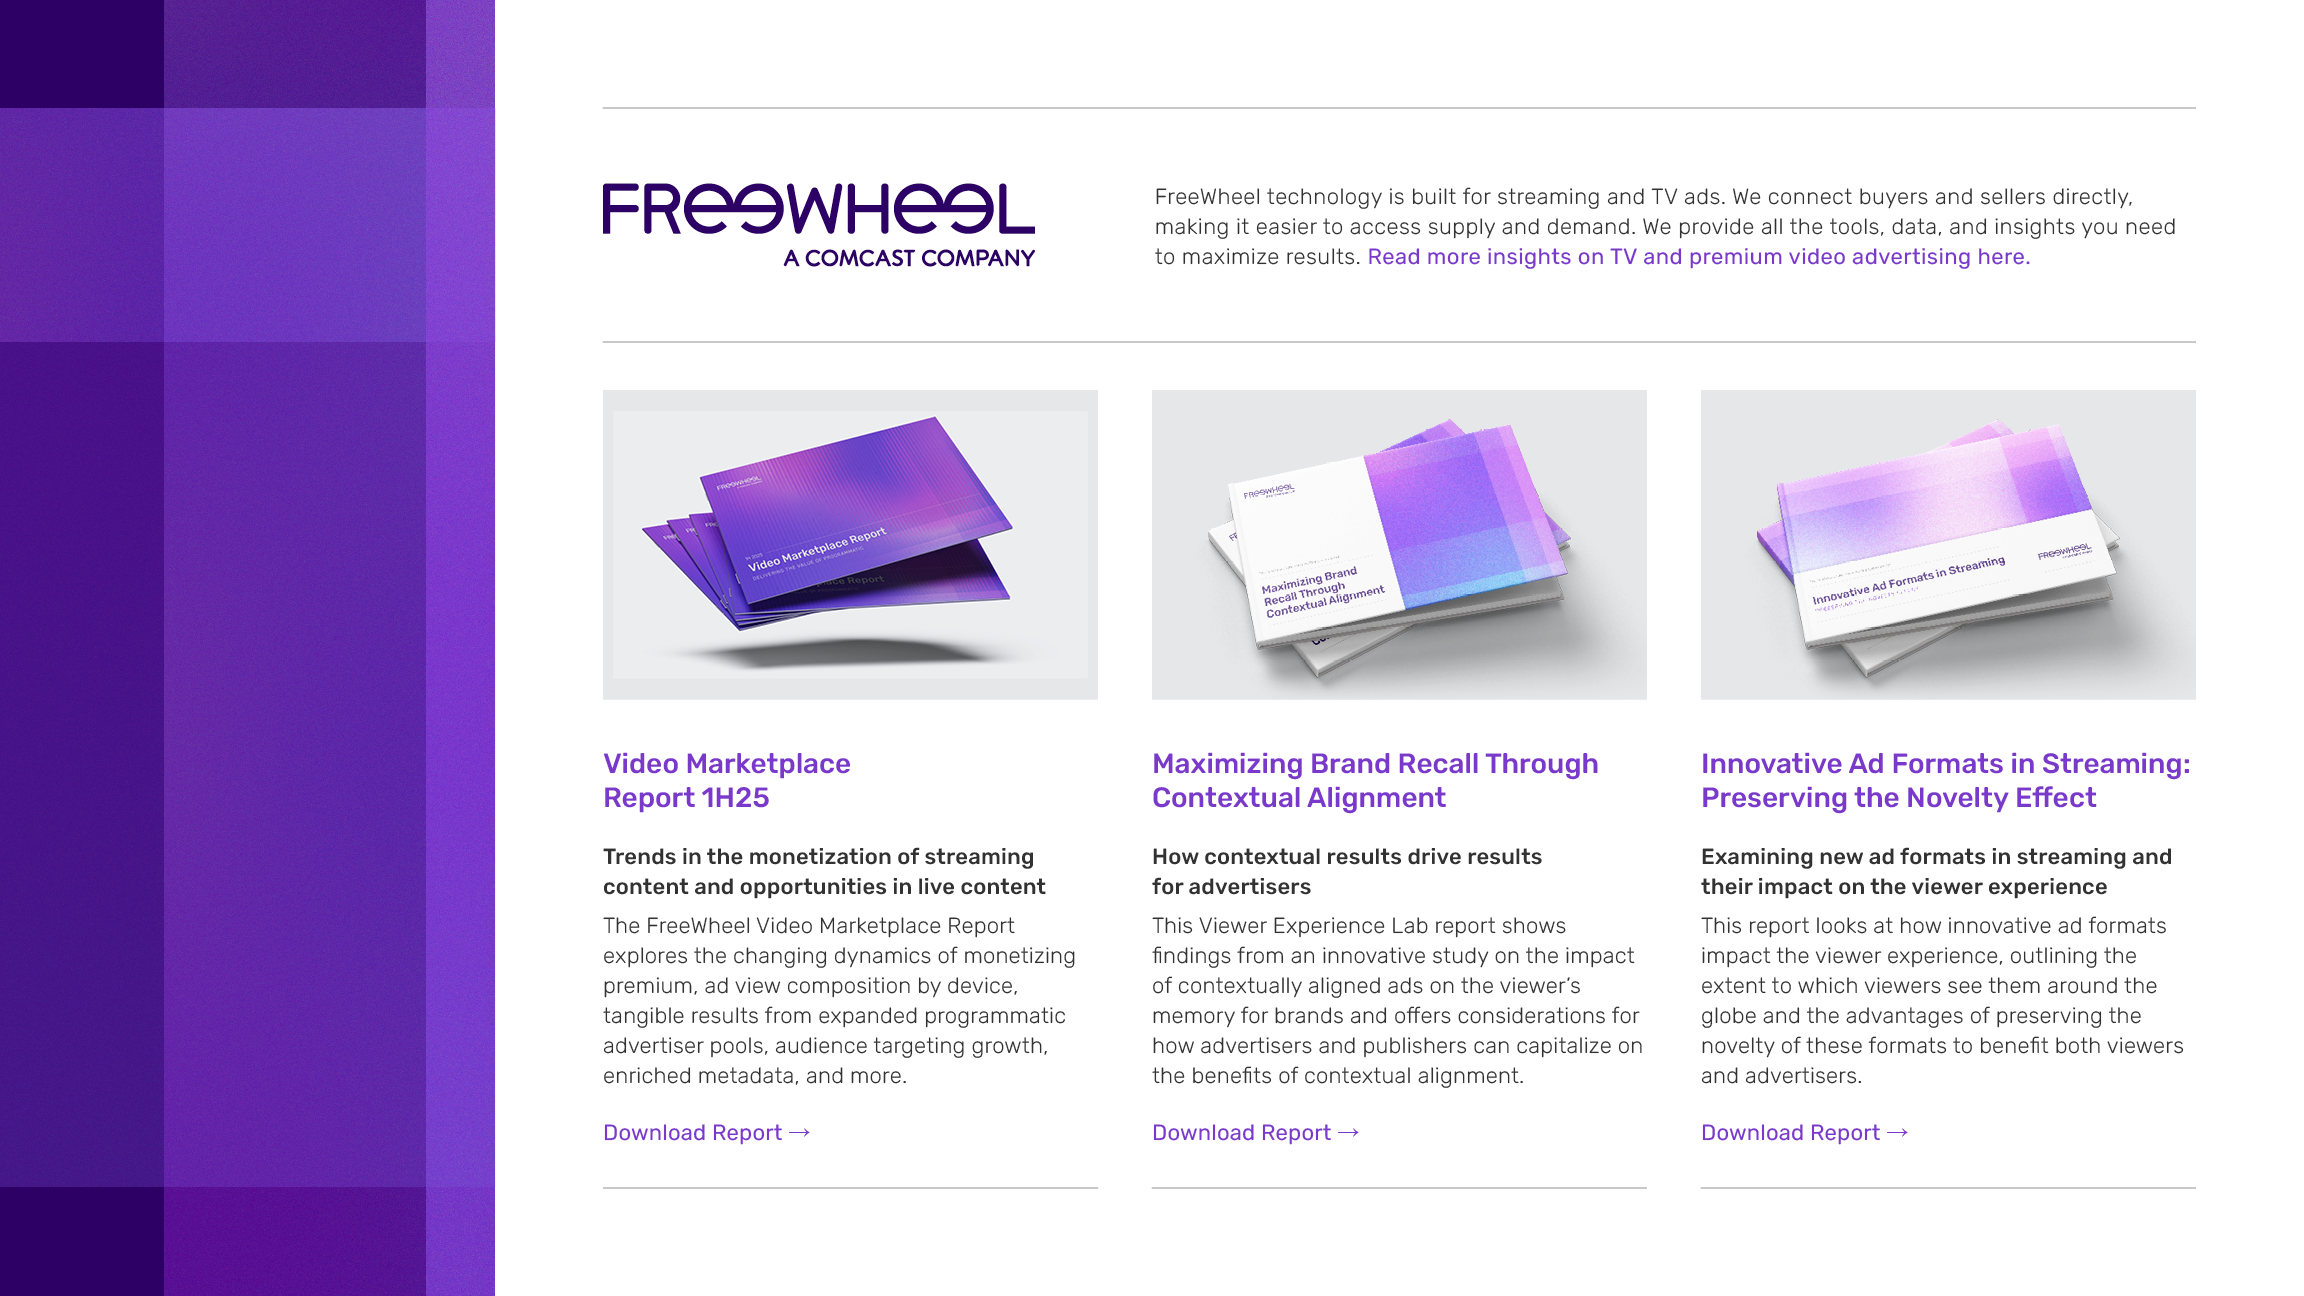
In addition to digital and event marketing, my team and I create industry reports every quarter with key insights to show our thought leadership, which gives our Sales, Marketing, and Insights teams more sales enablement materials. The reports require close collaboration across multiple teams and executive approval, allowing me to hone my presentation skills and dial in on presenting design decisions to non-creatives at all levels of the business.
Services
Data representation and chart design
Graphic design and layout
Photo manipulation and editing
Presentation design
Social media graphics design
Tools
Adobe InDesign
Adobe Illustrator
Adobe Photoshop
Microsoft PowerPoint

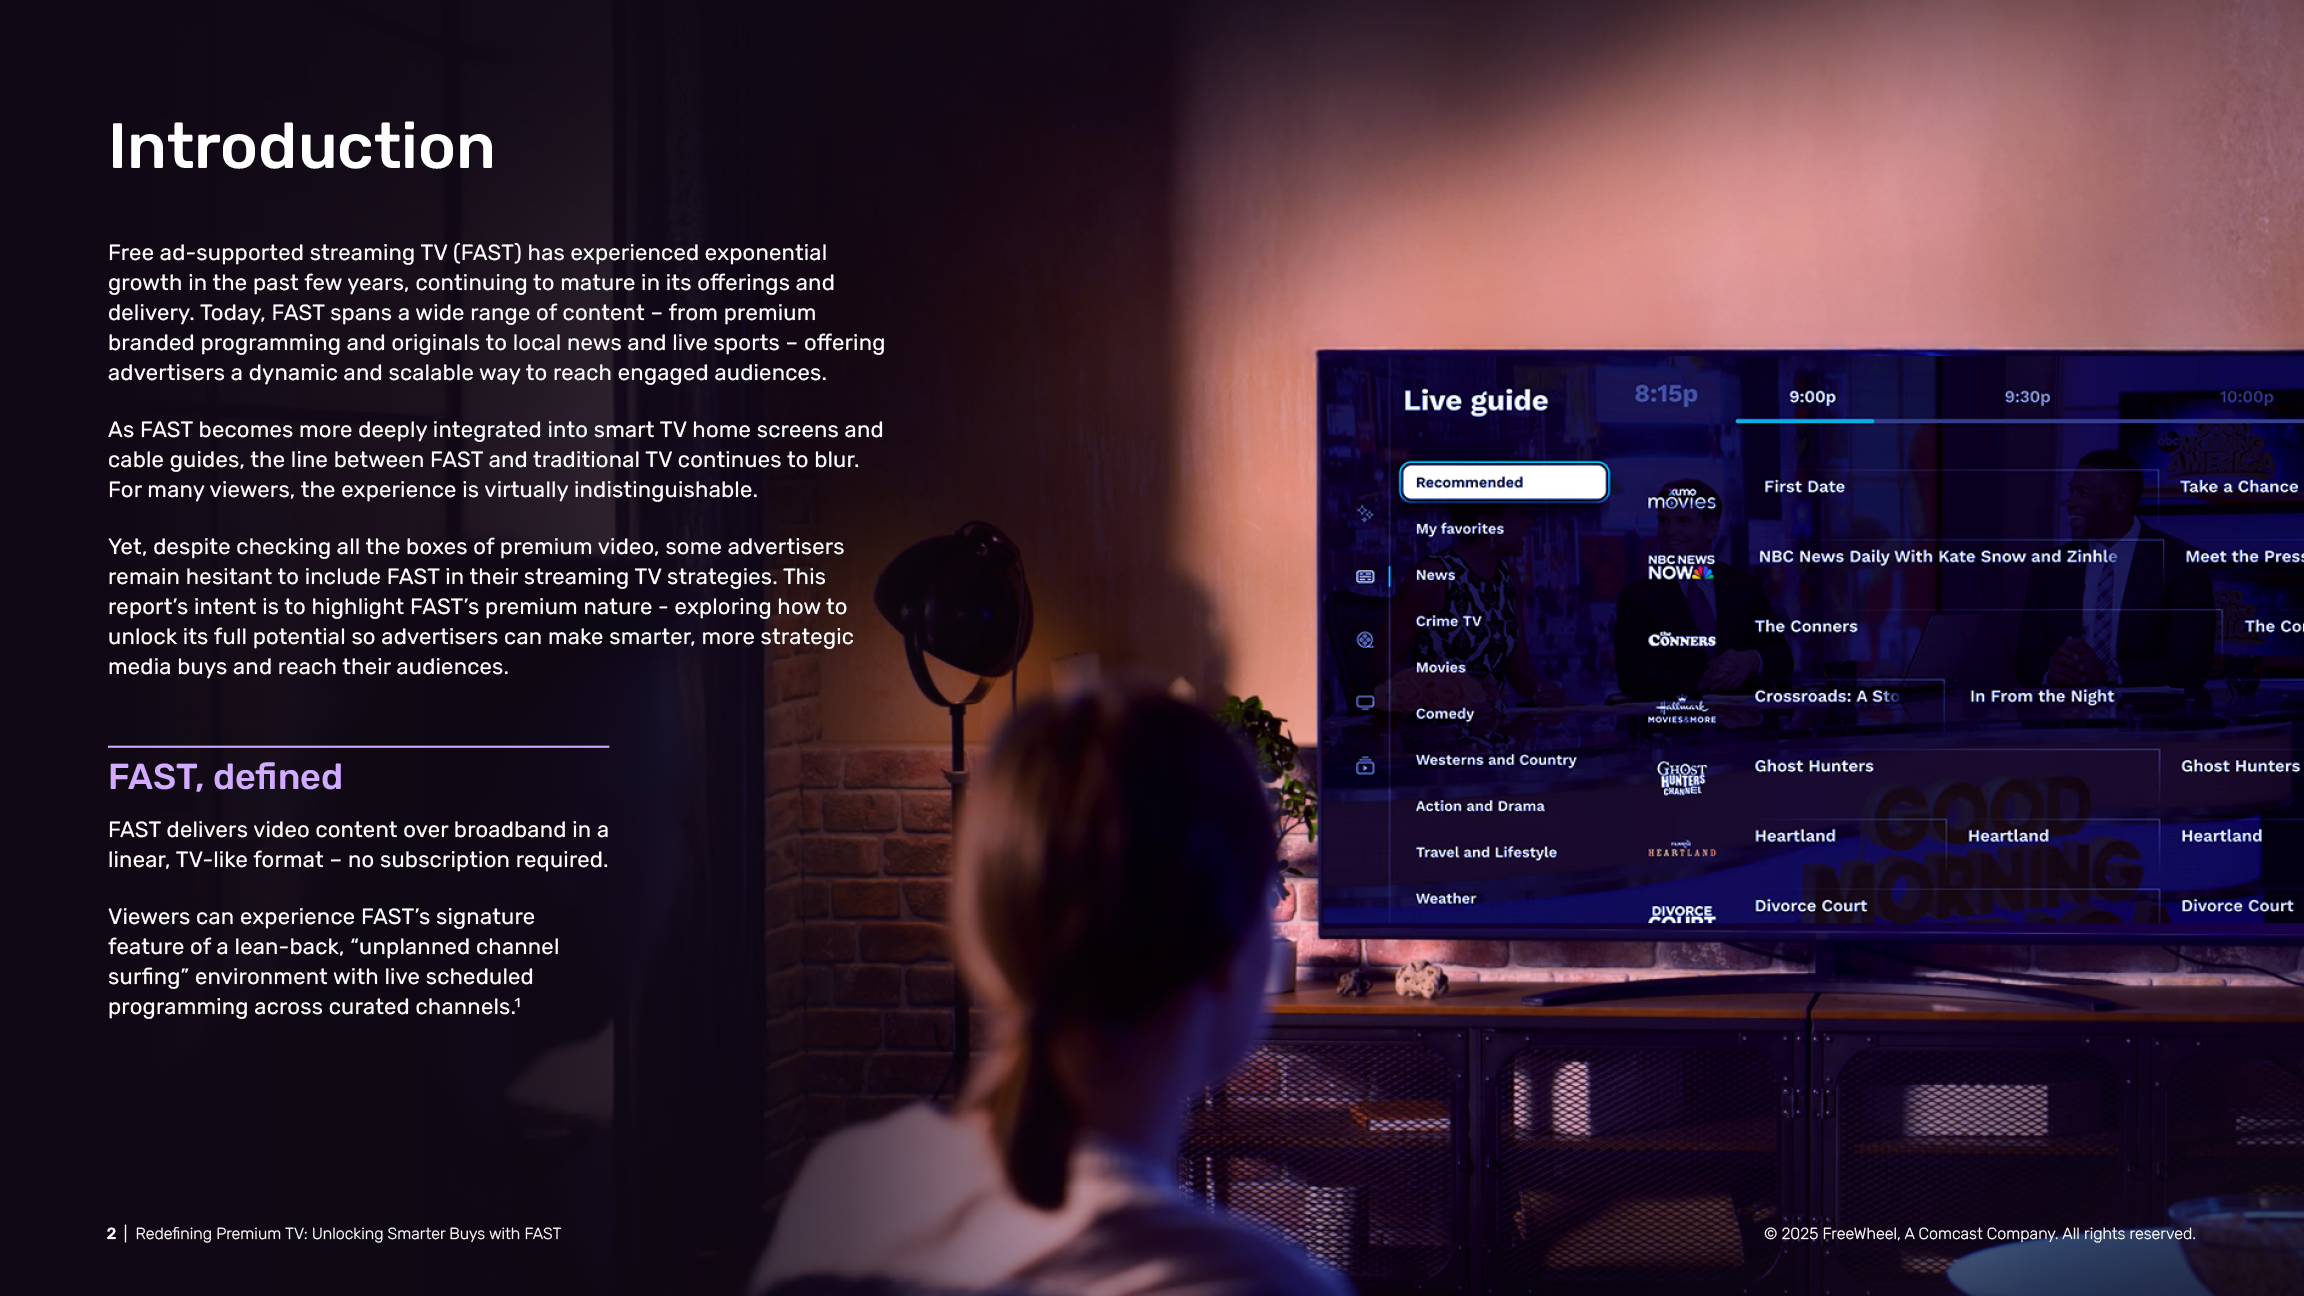
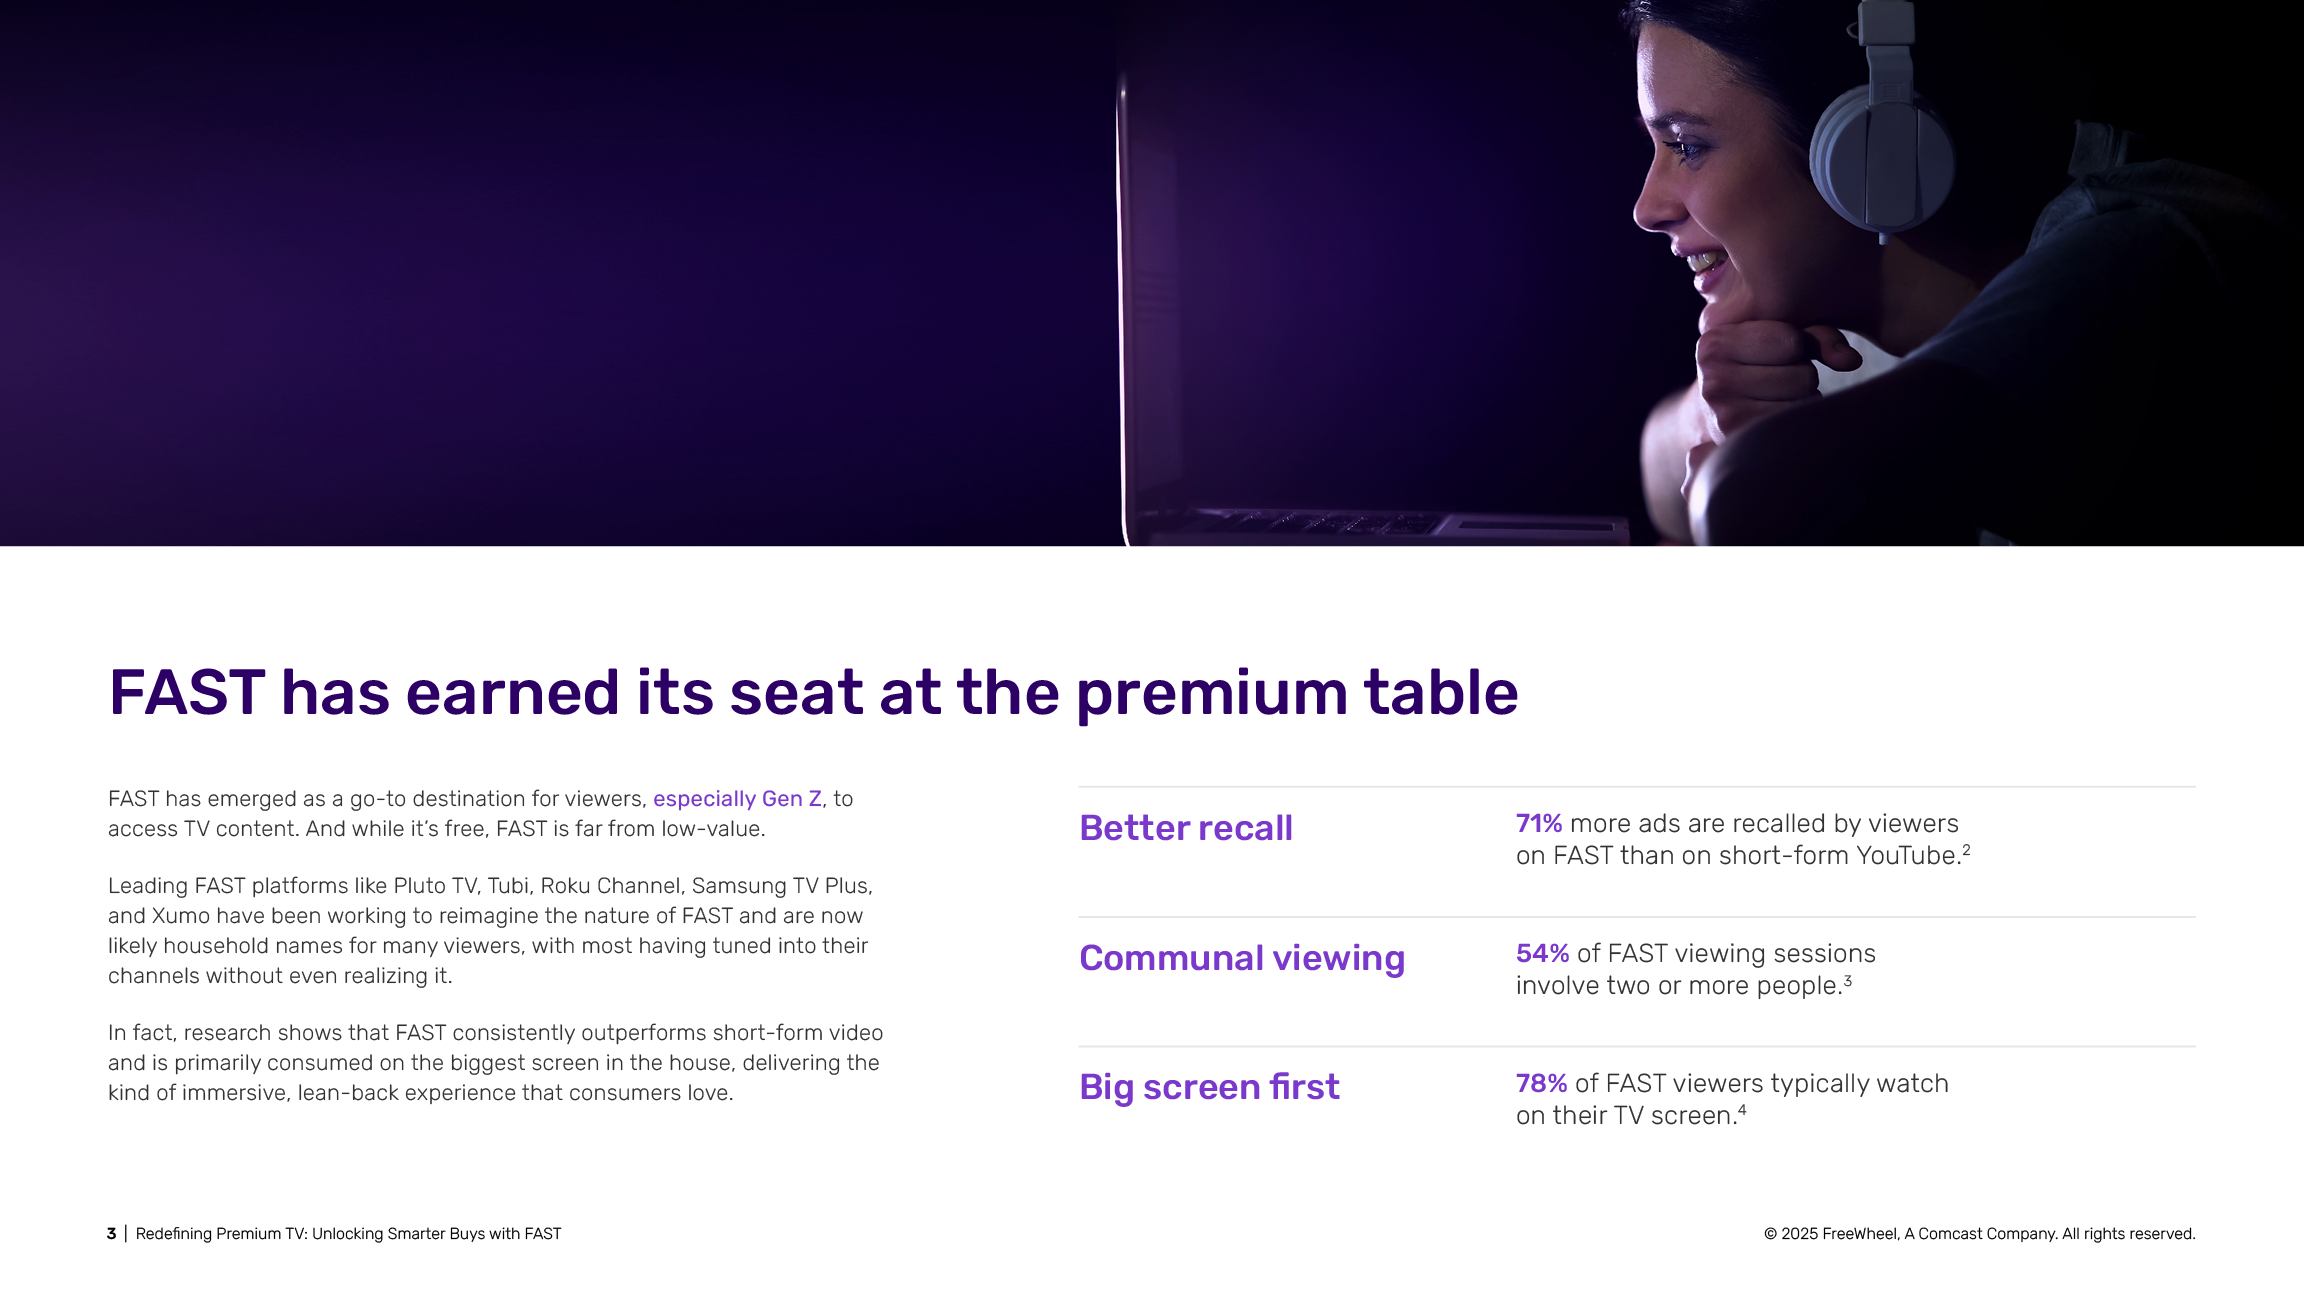
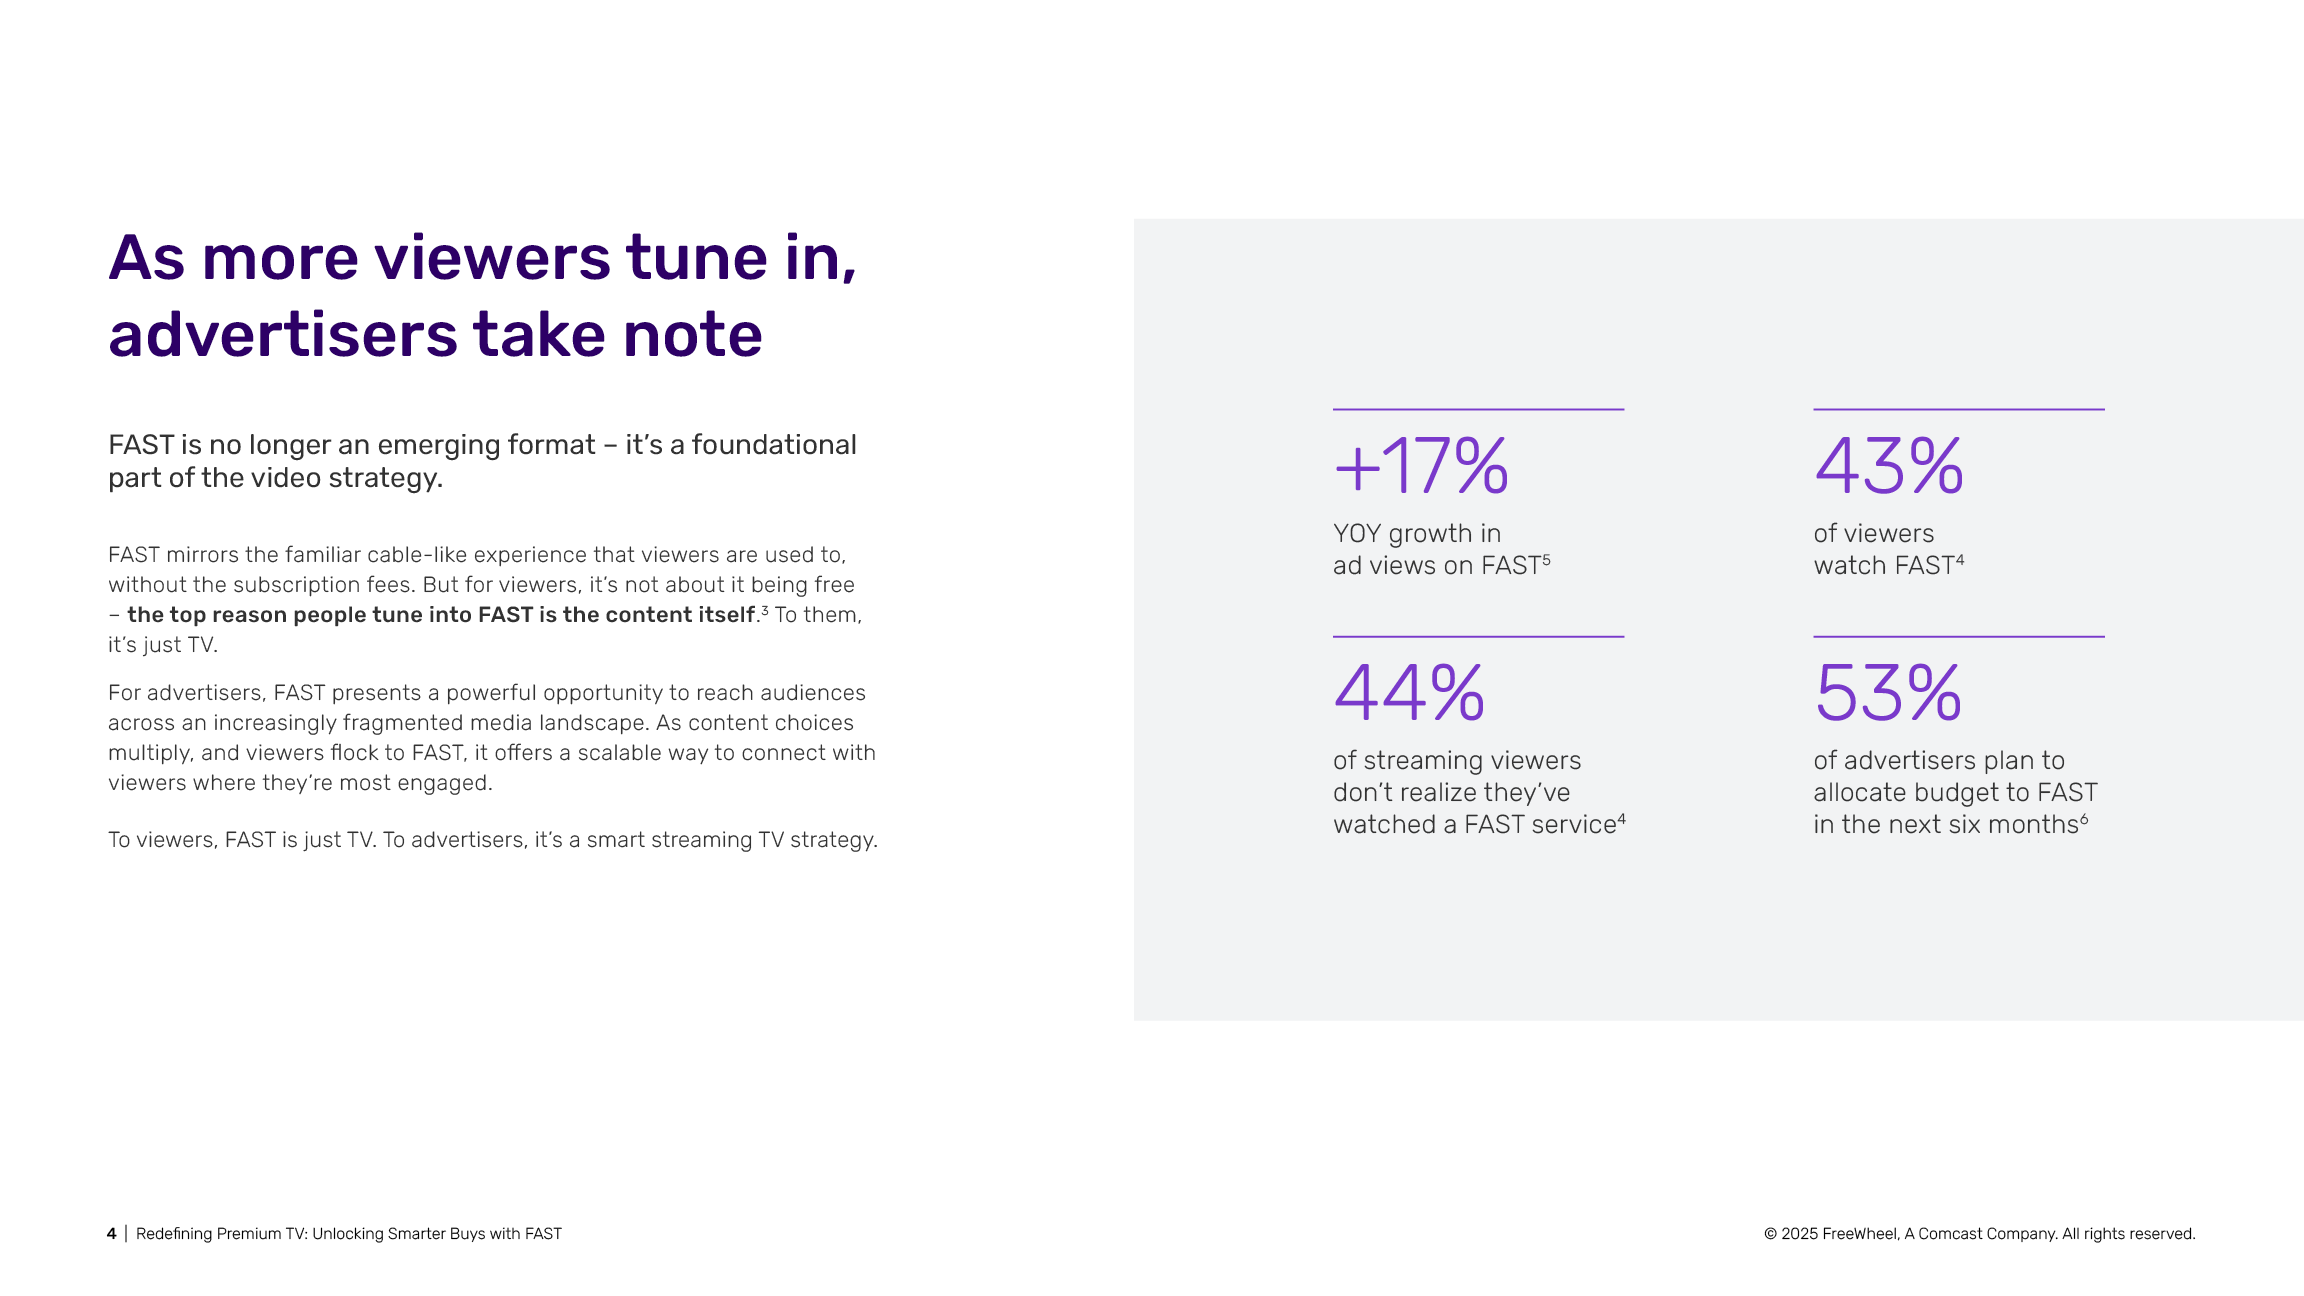

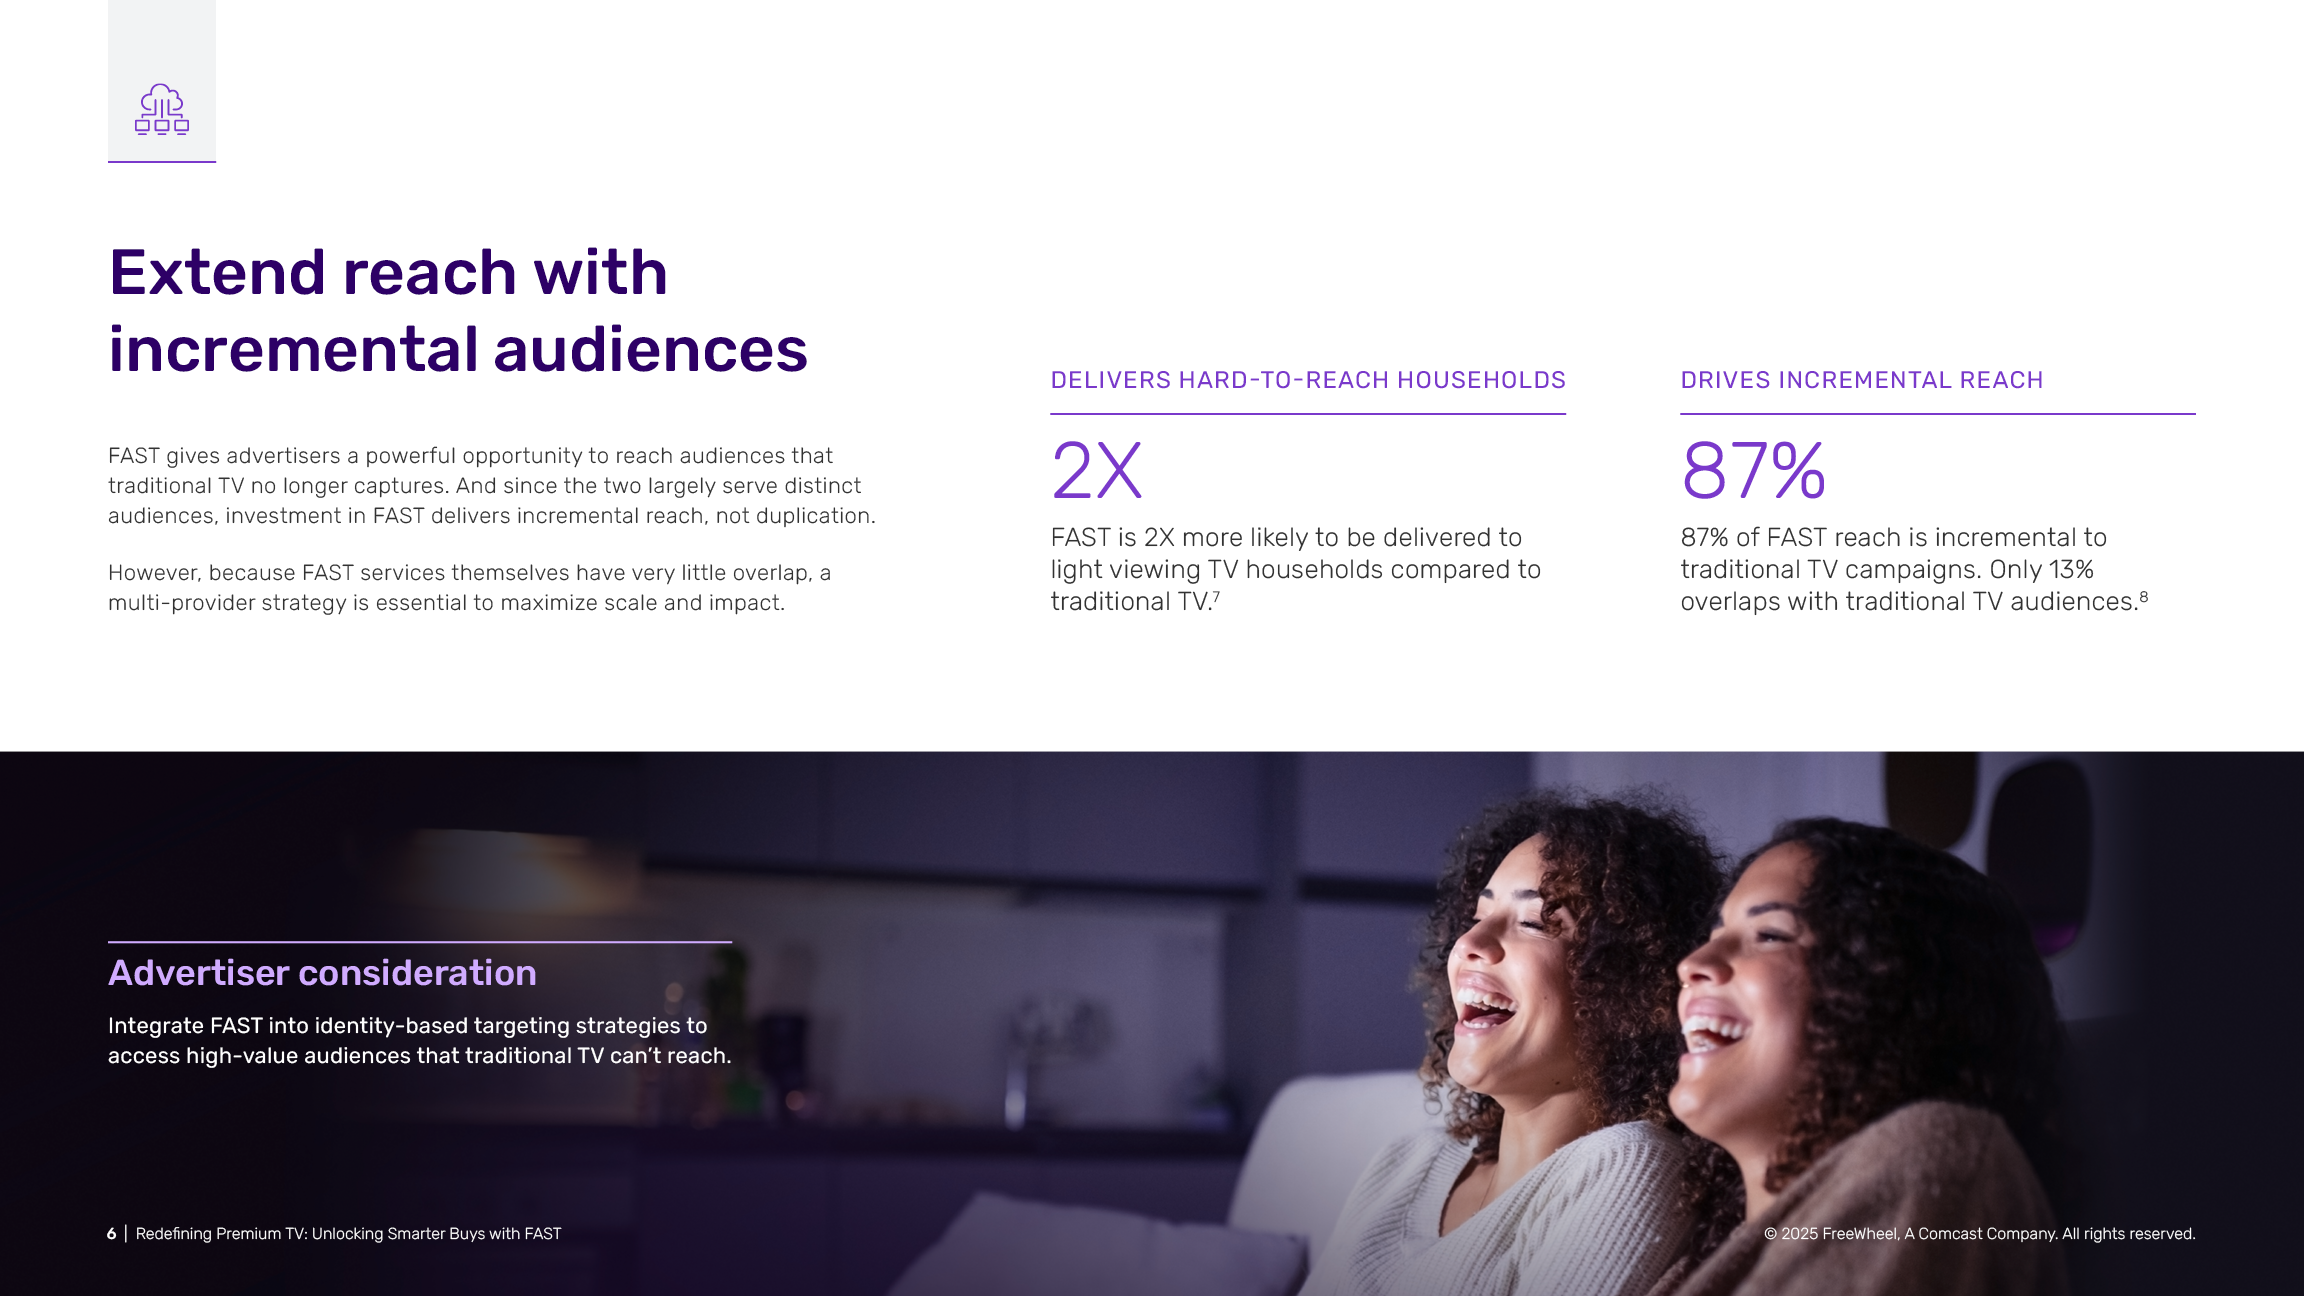
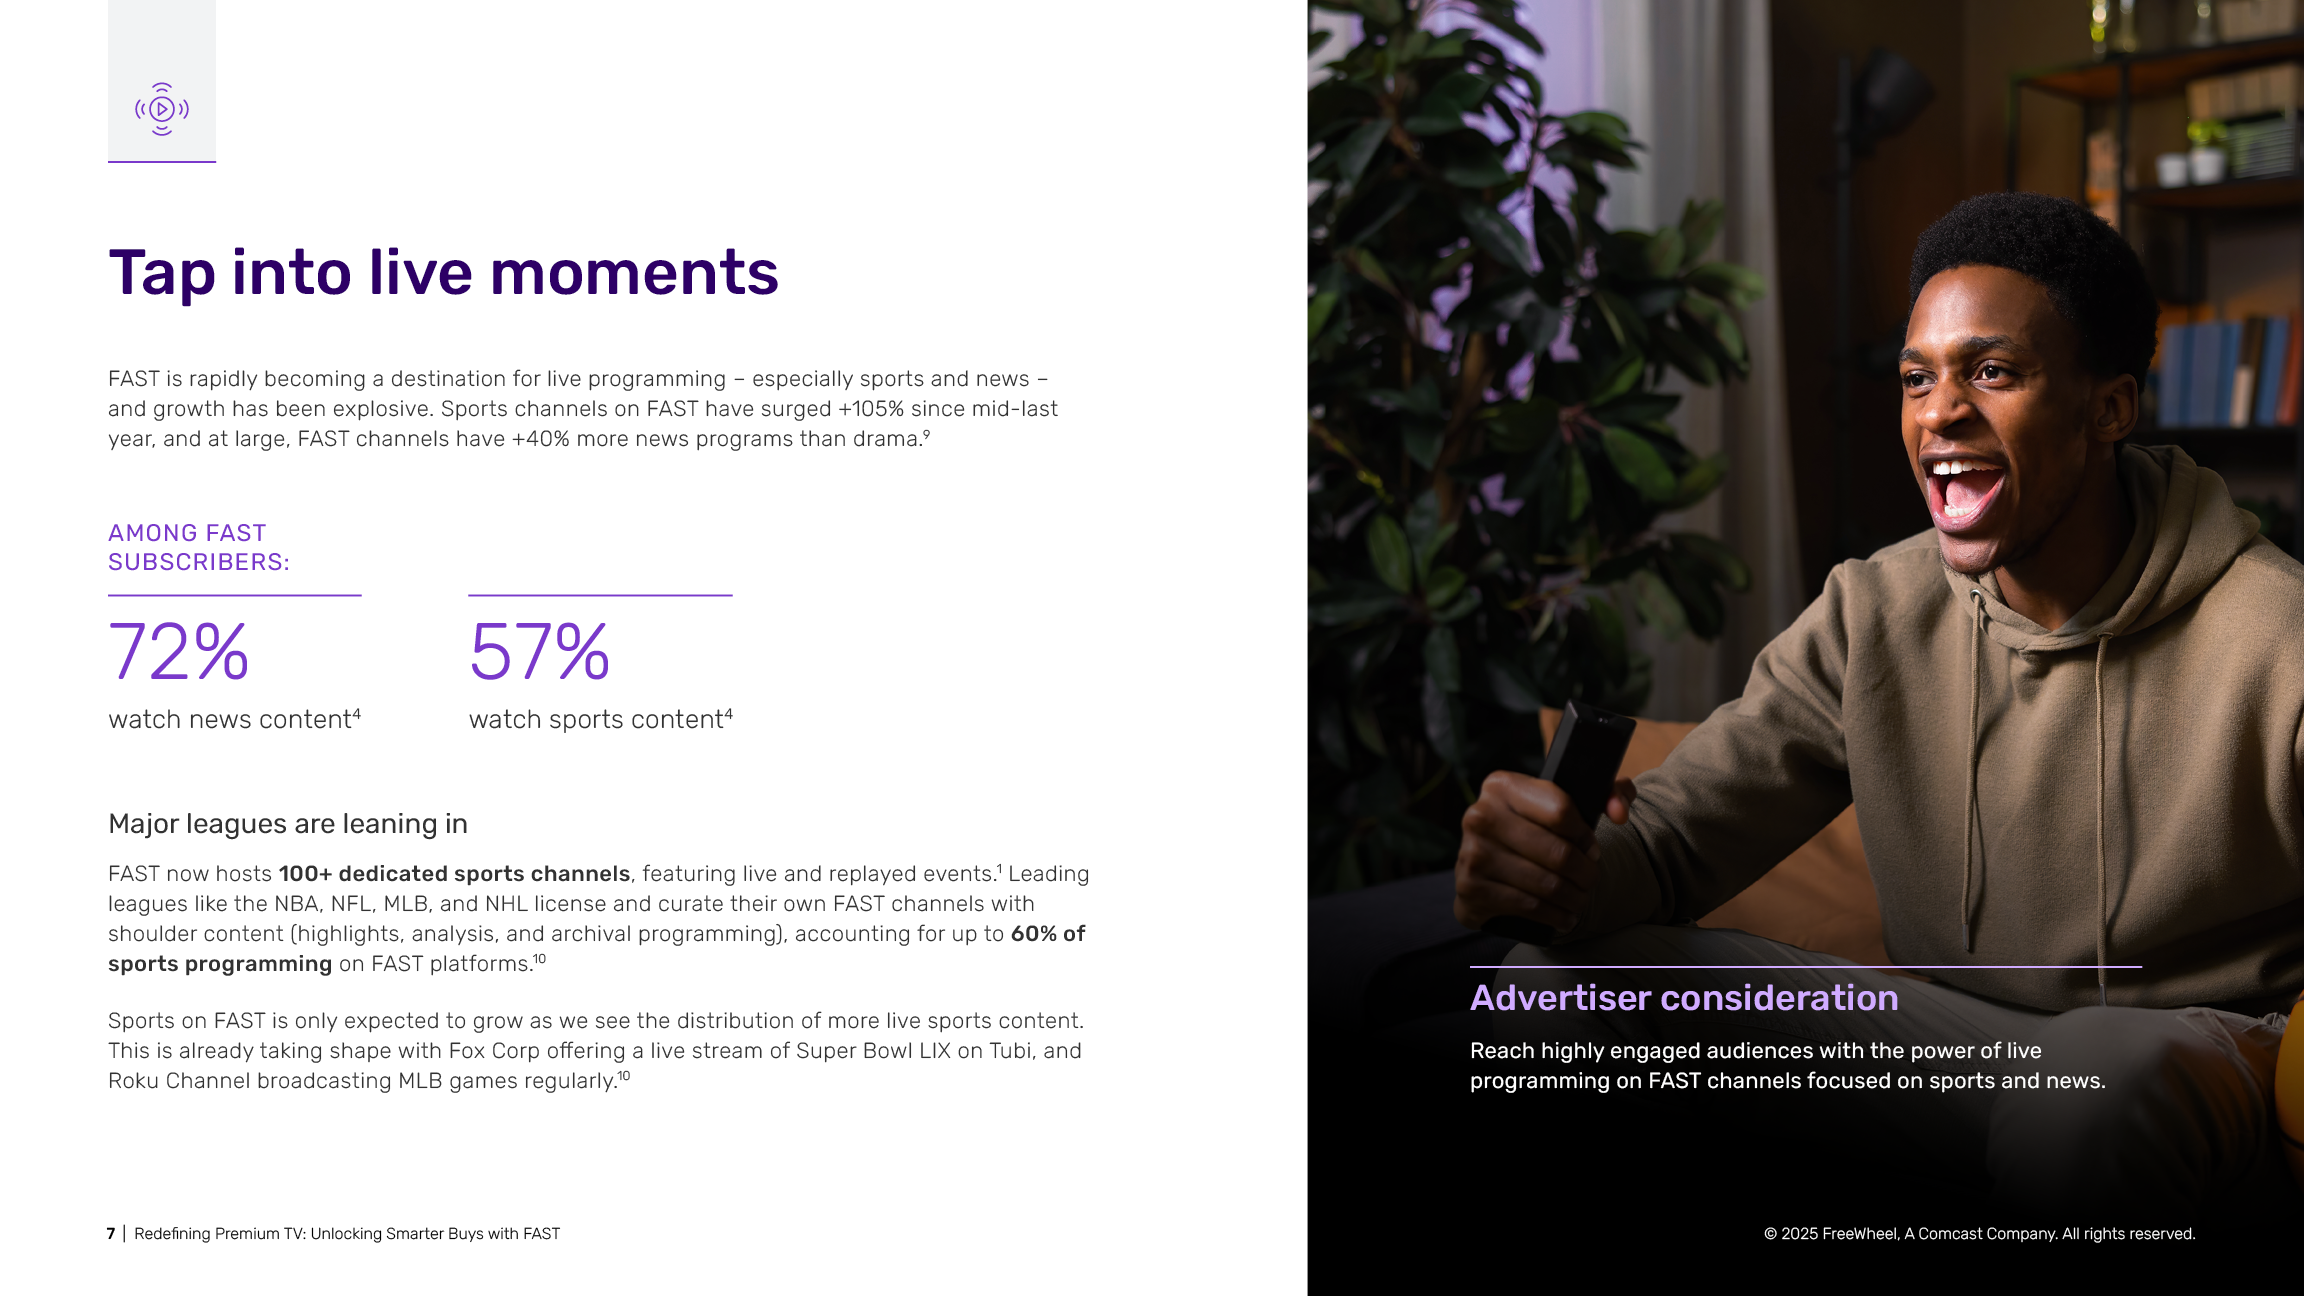
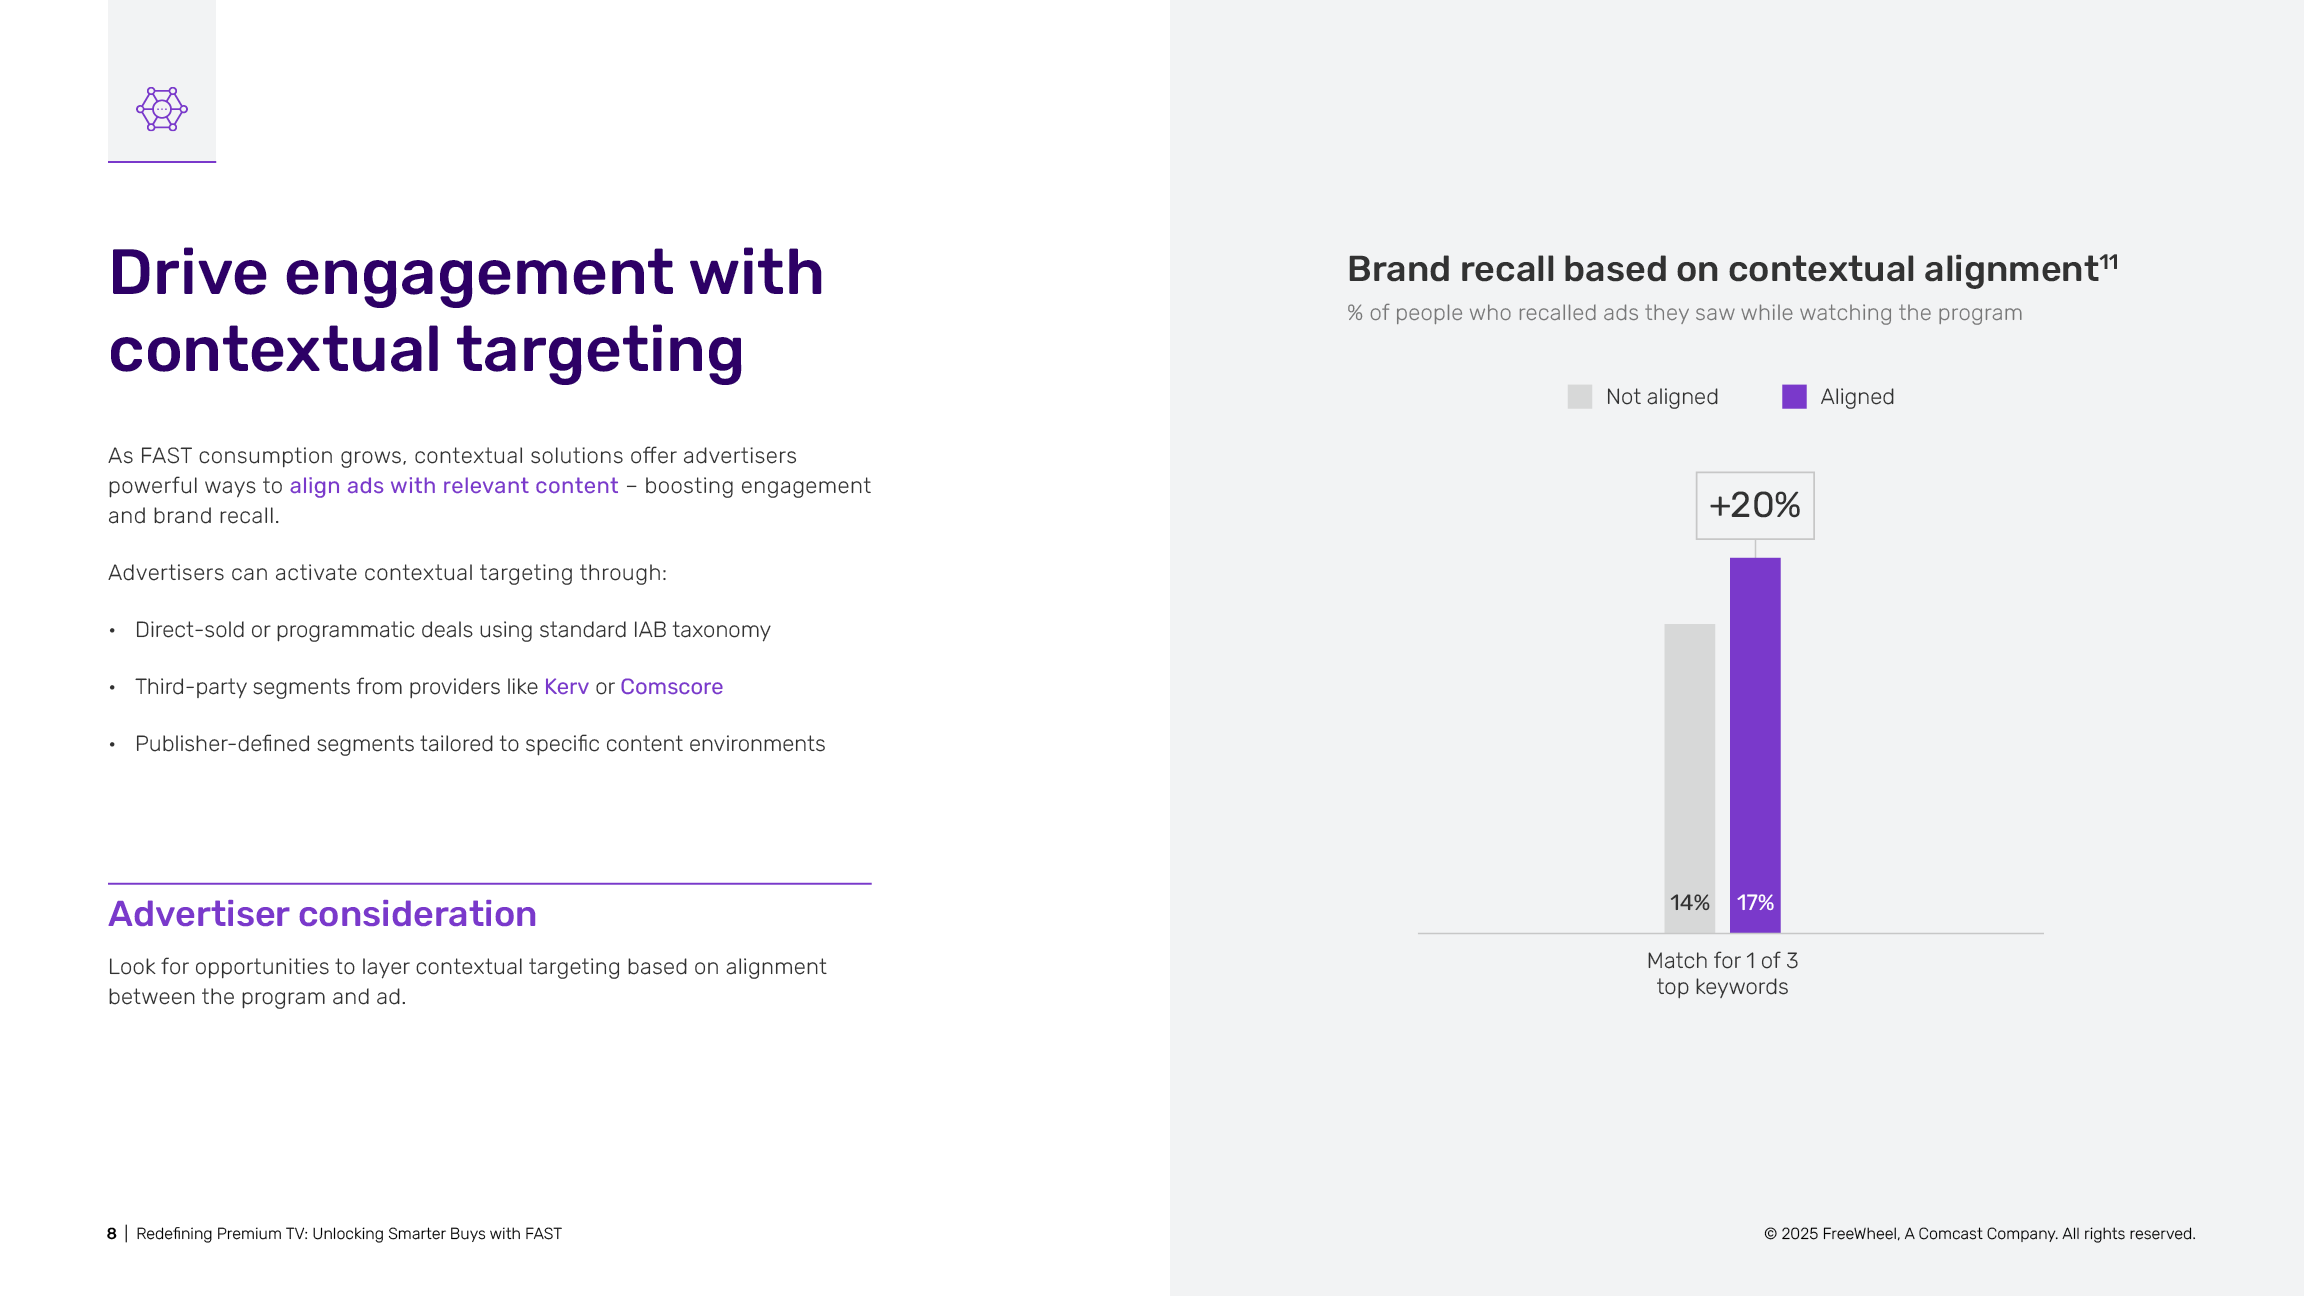
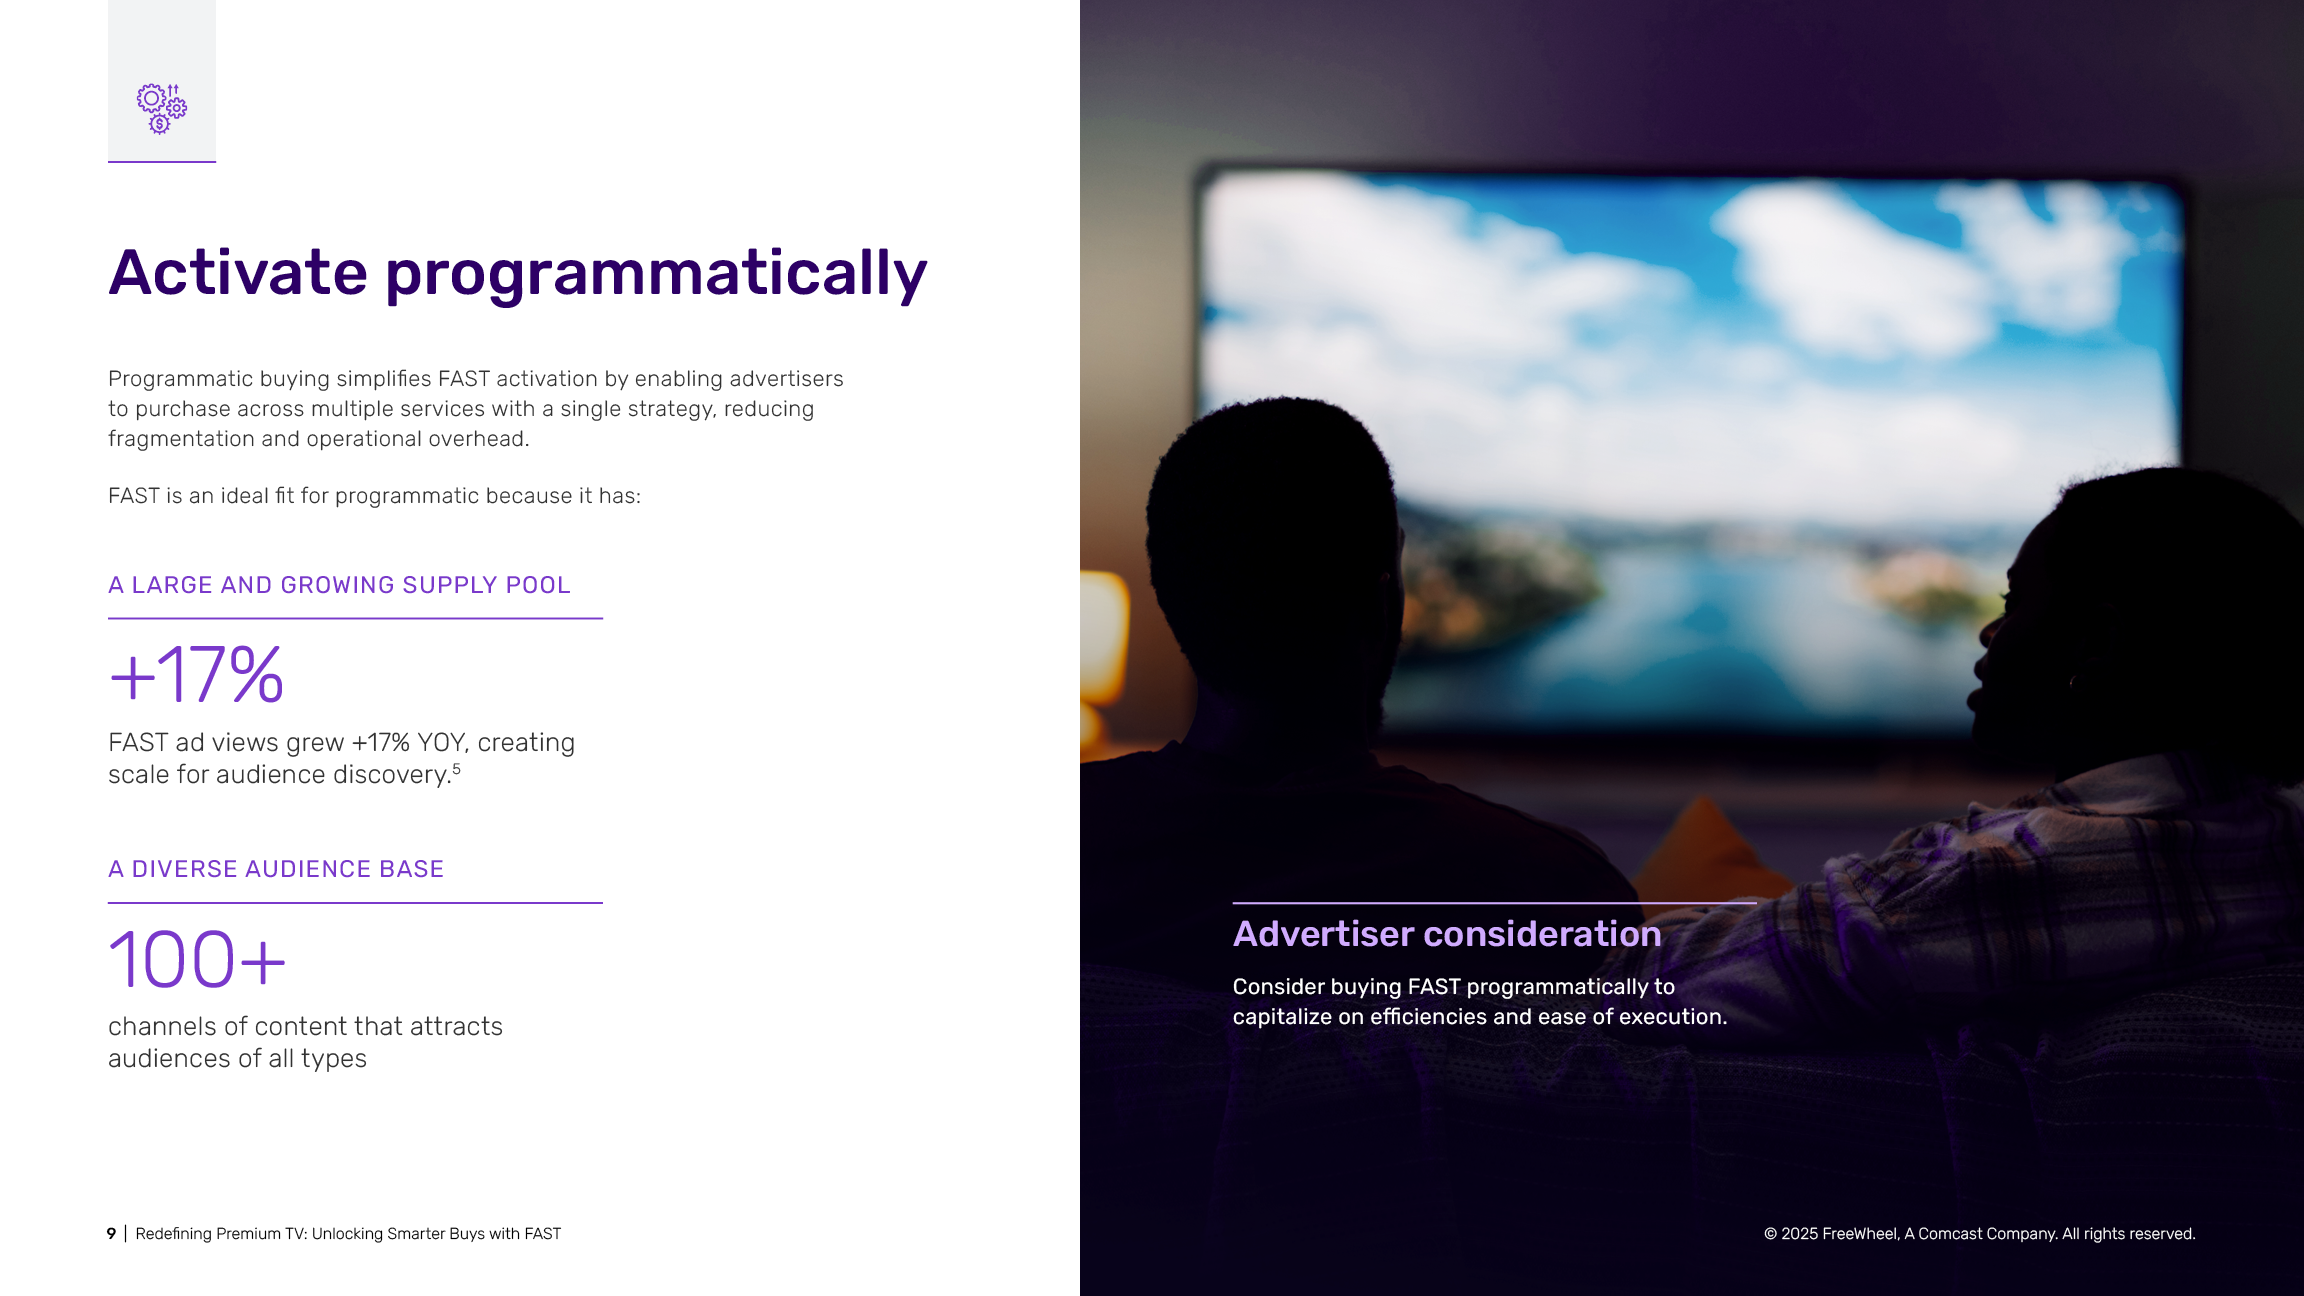
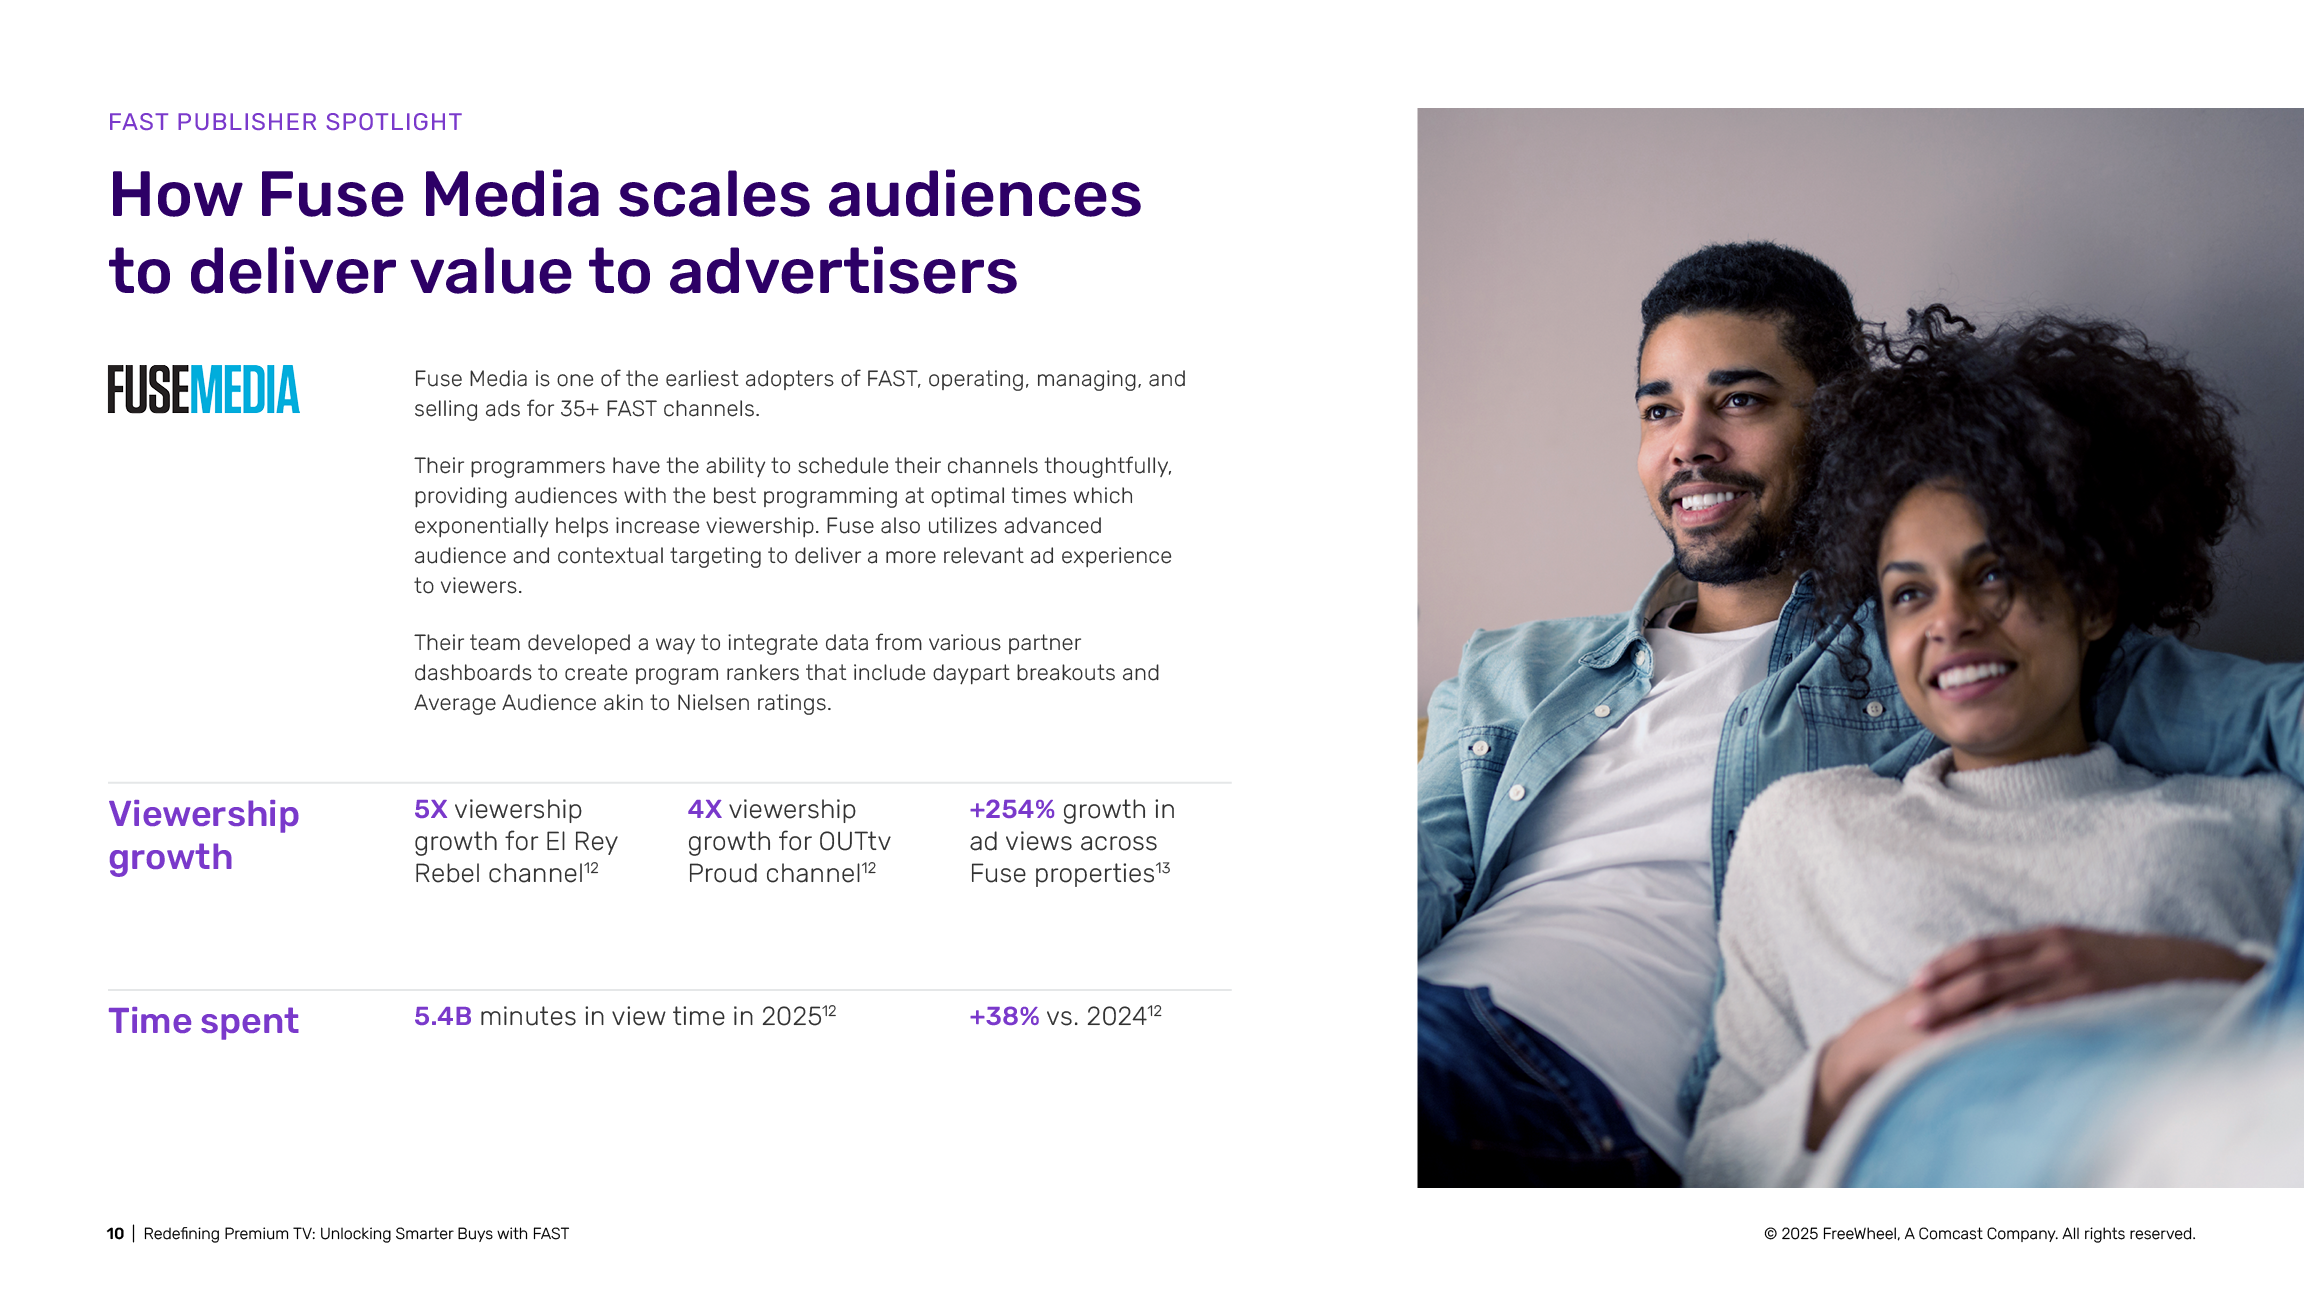

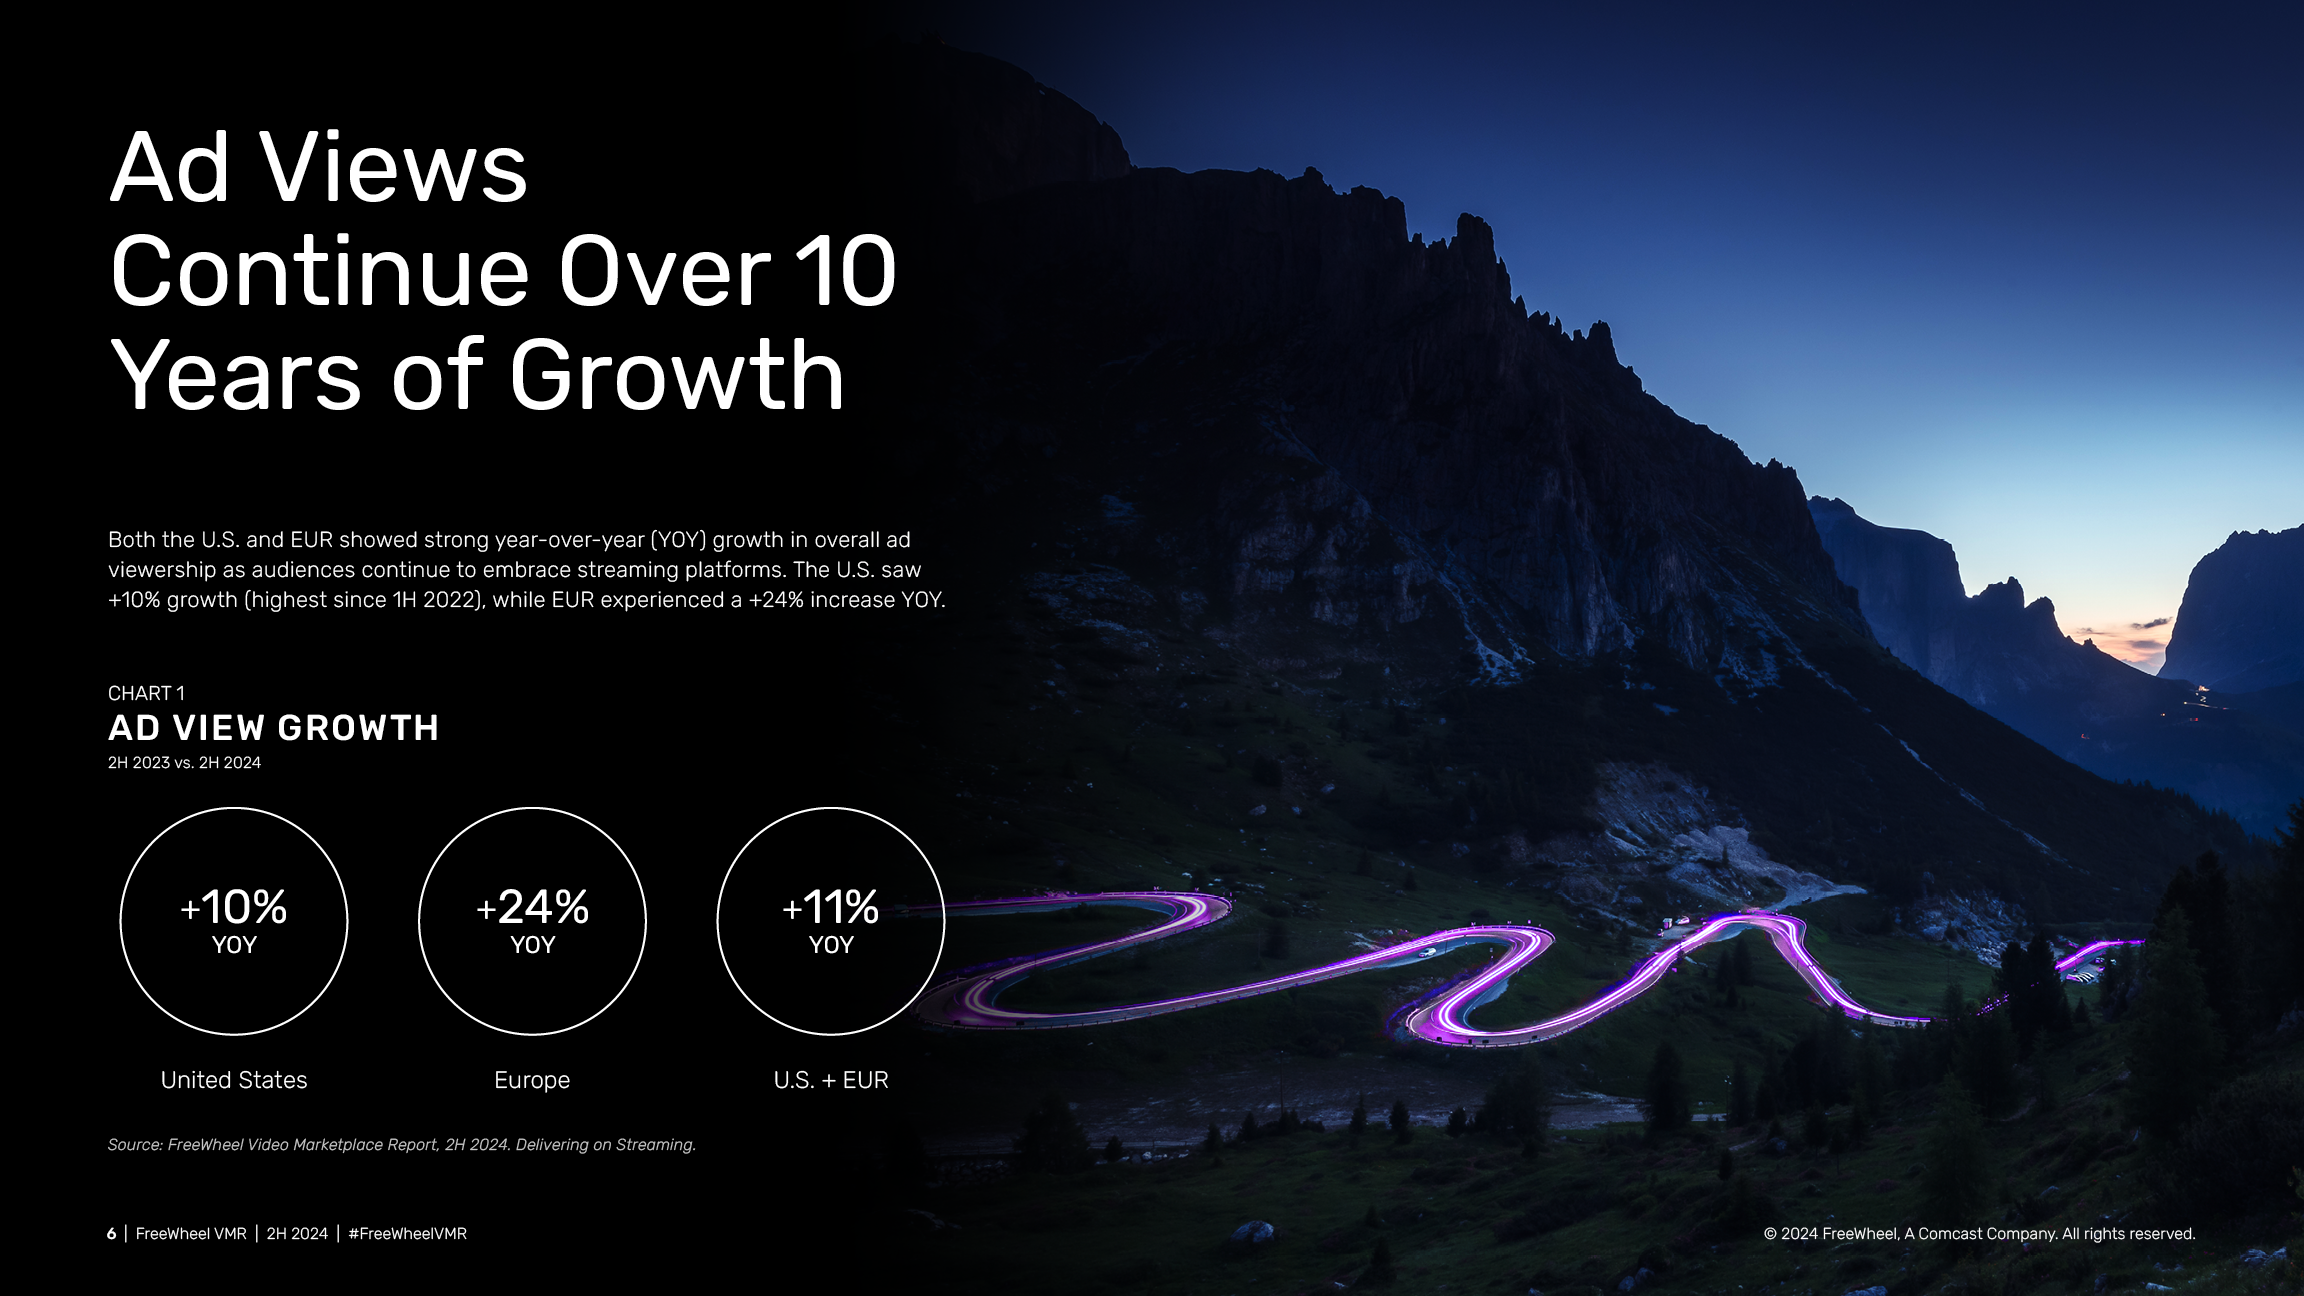
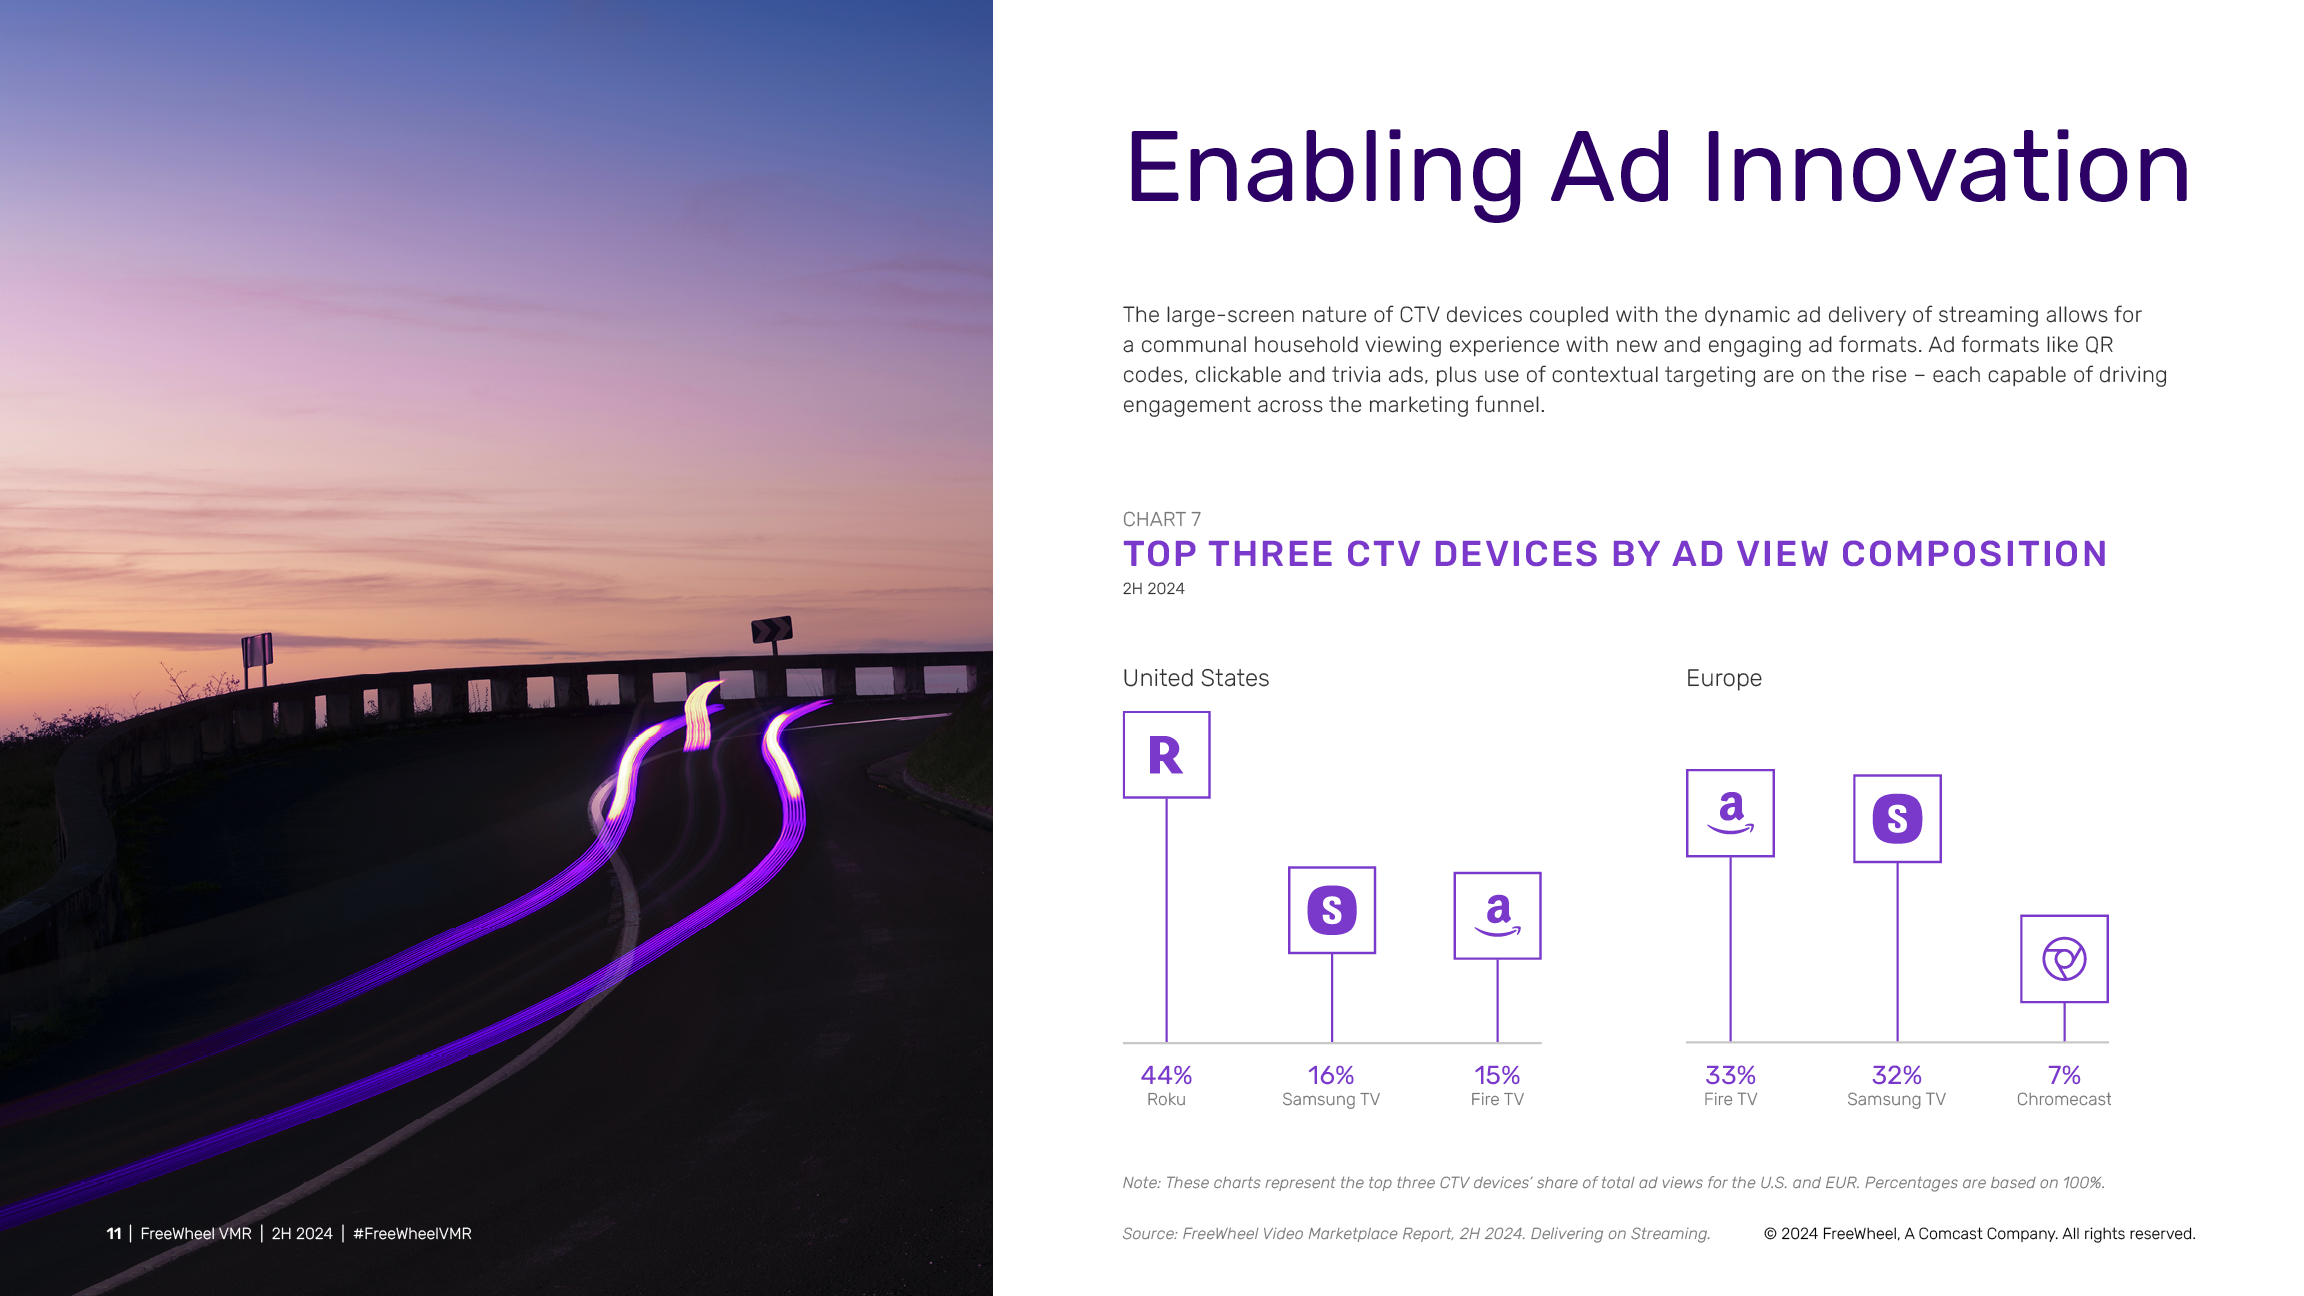
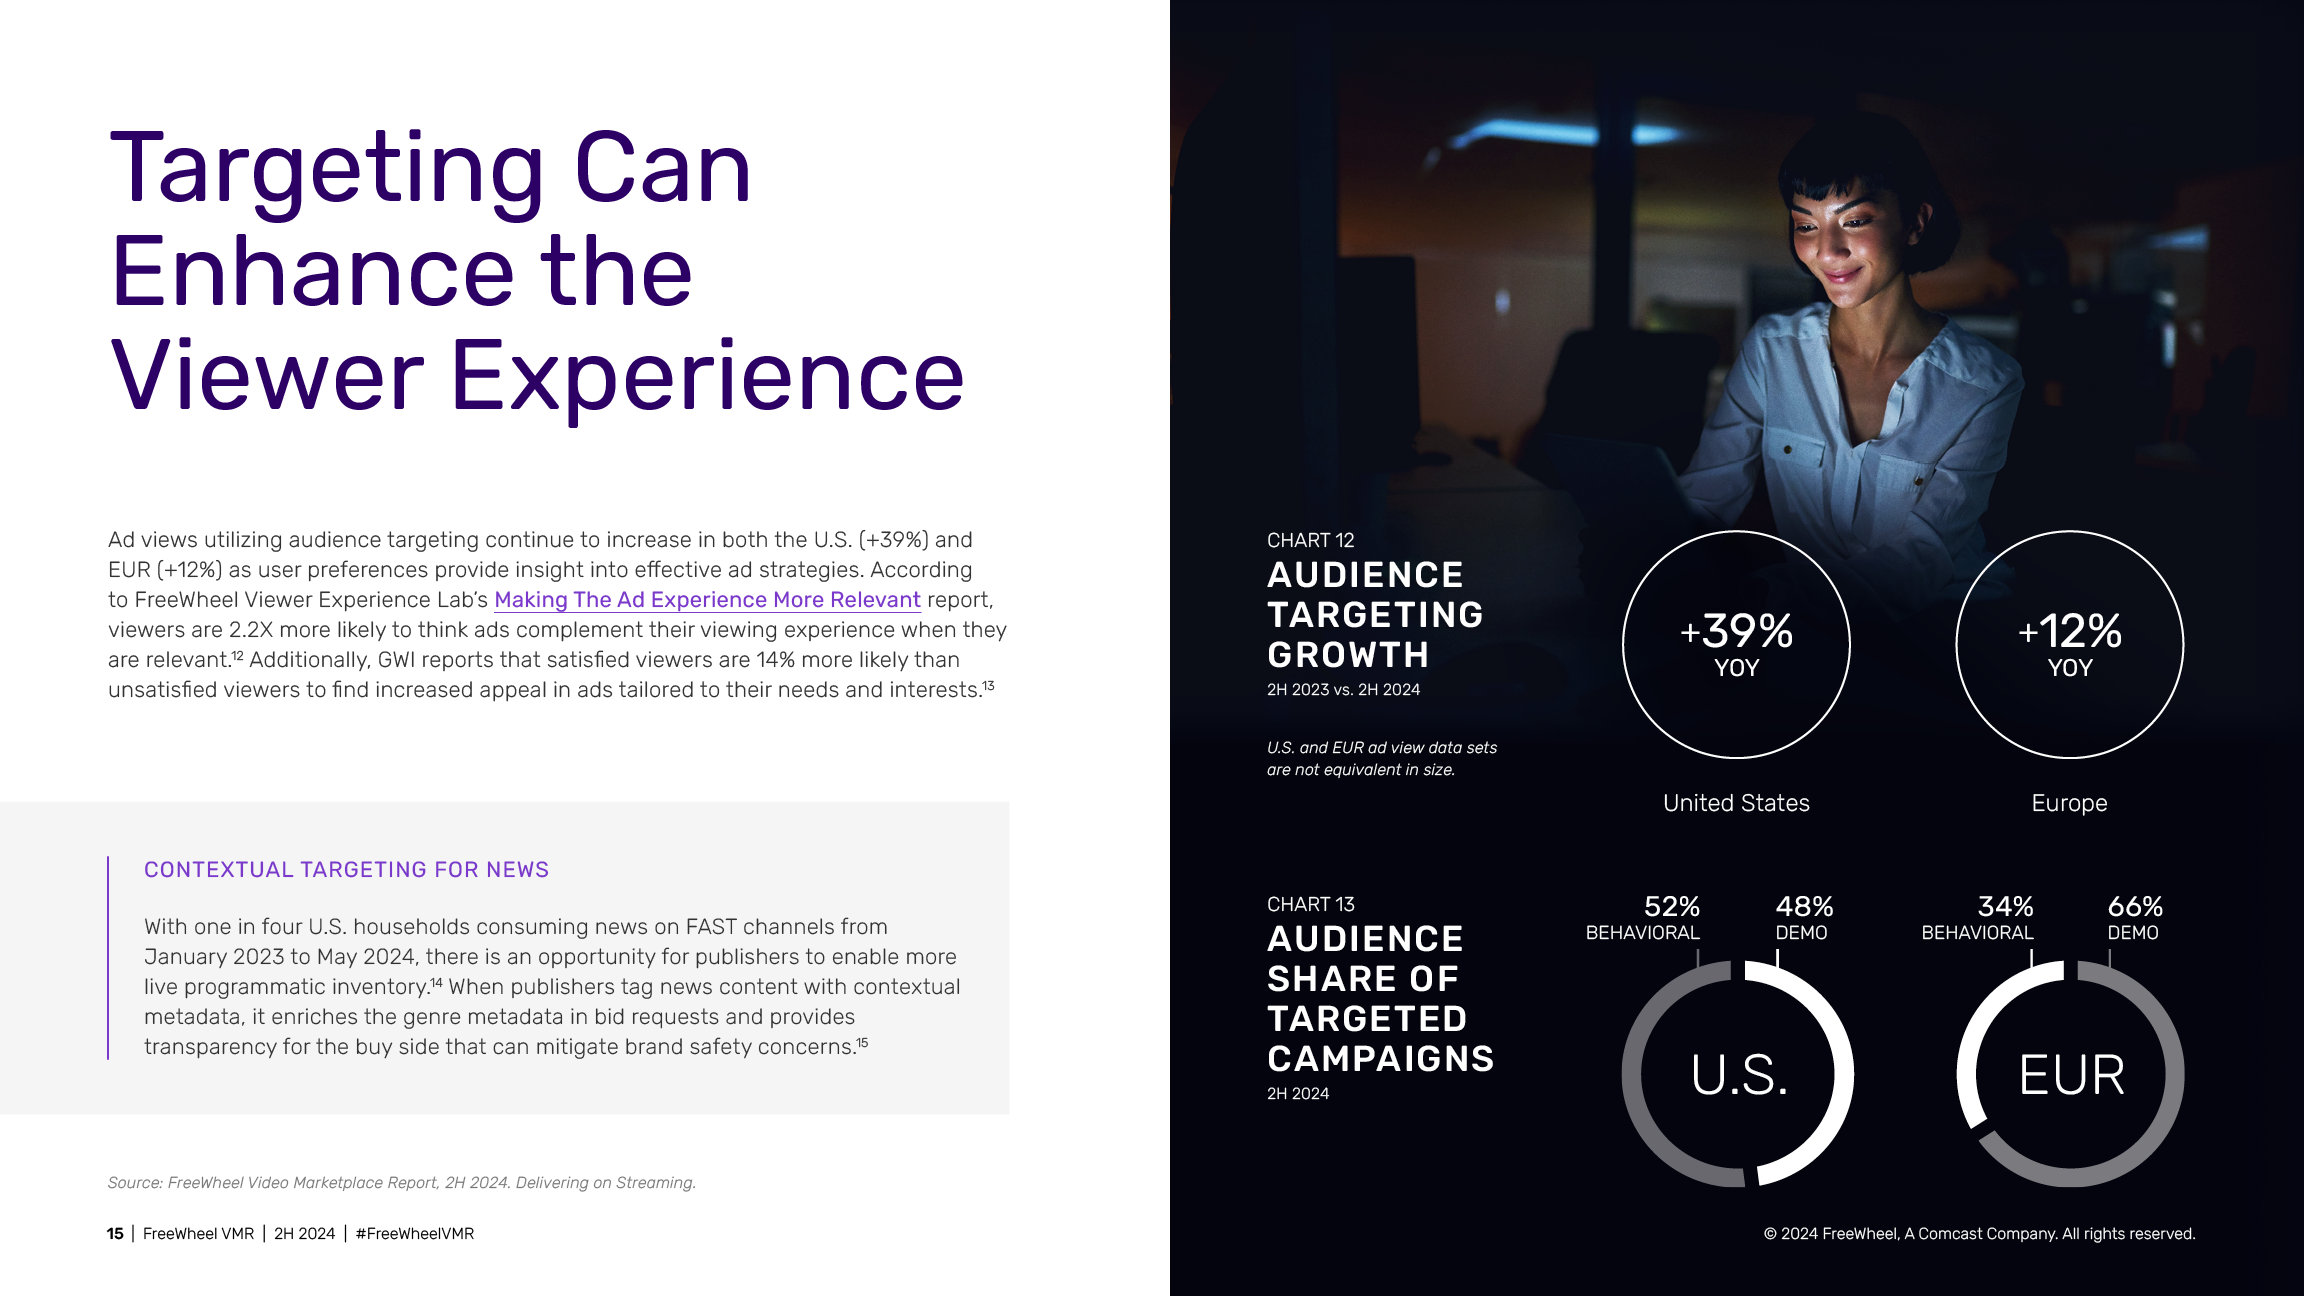
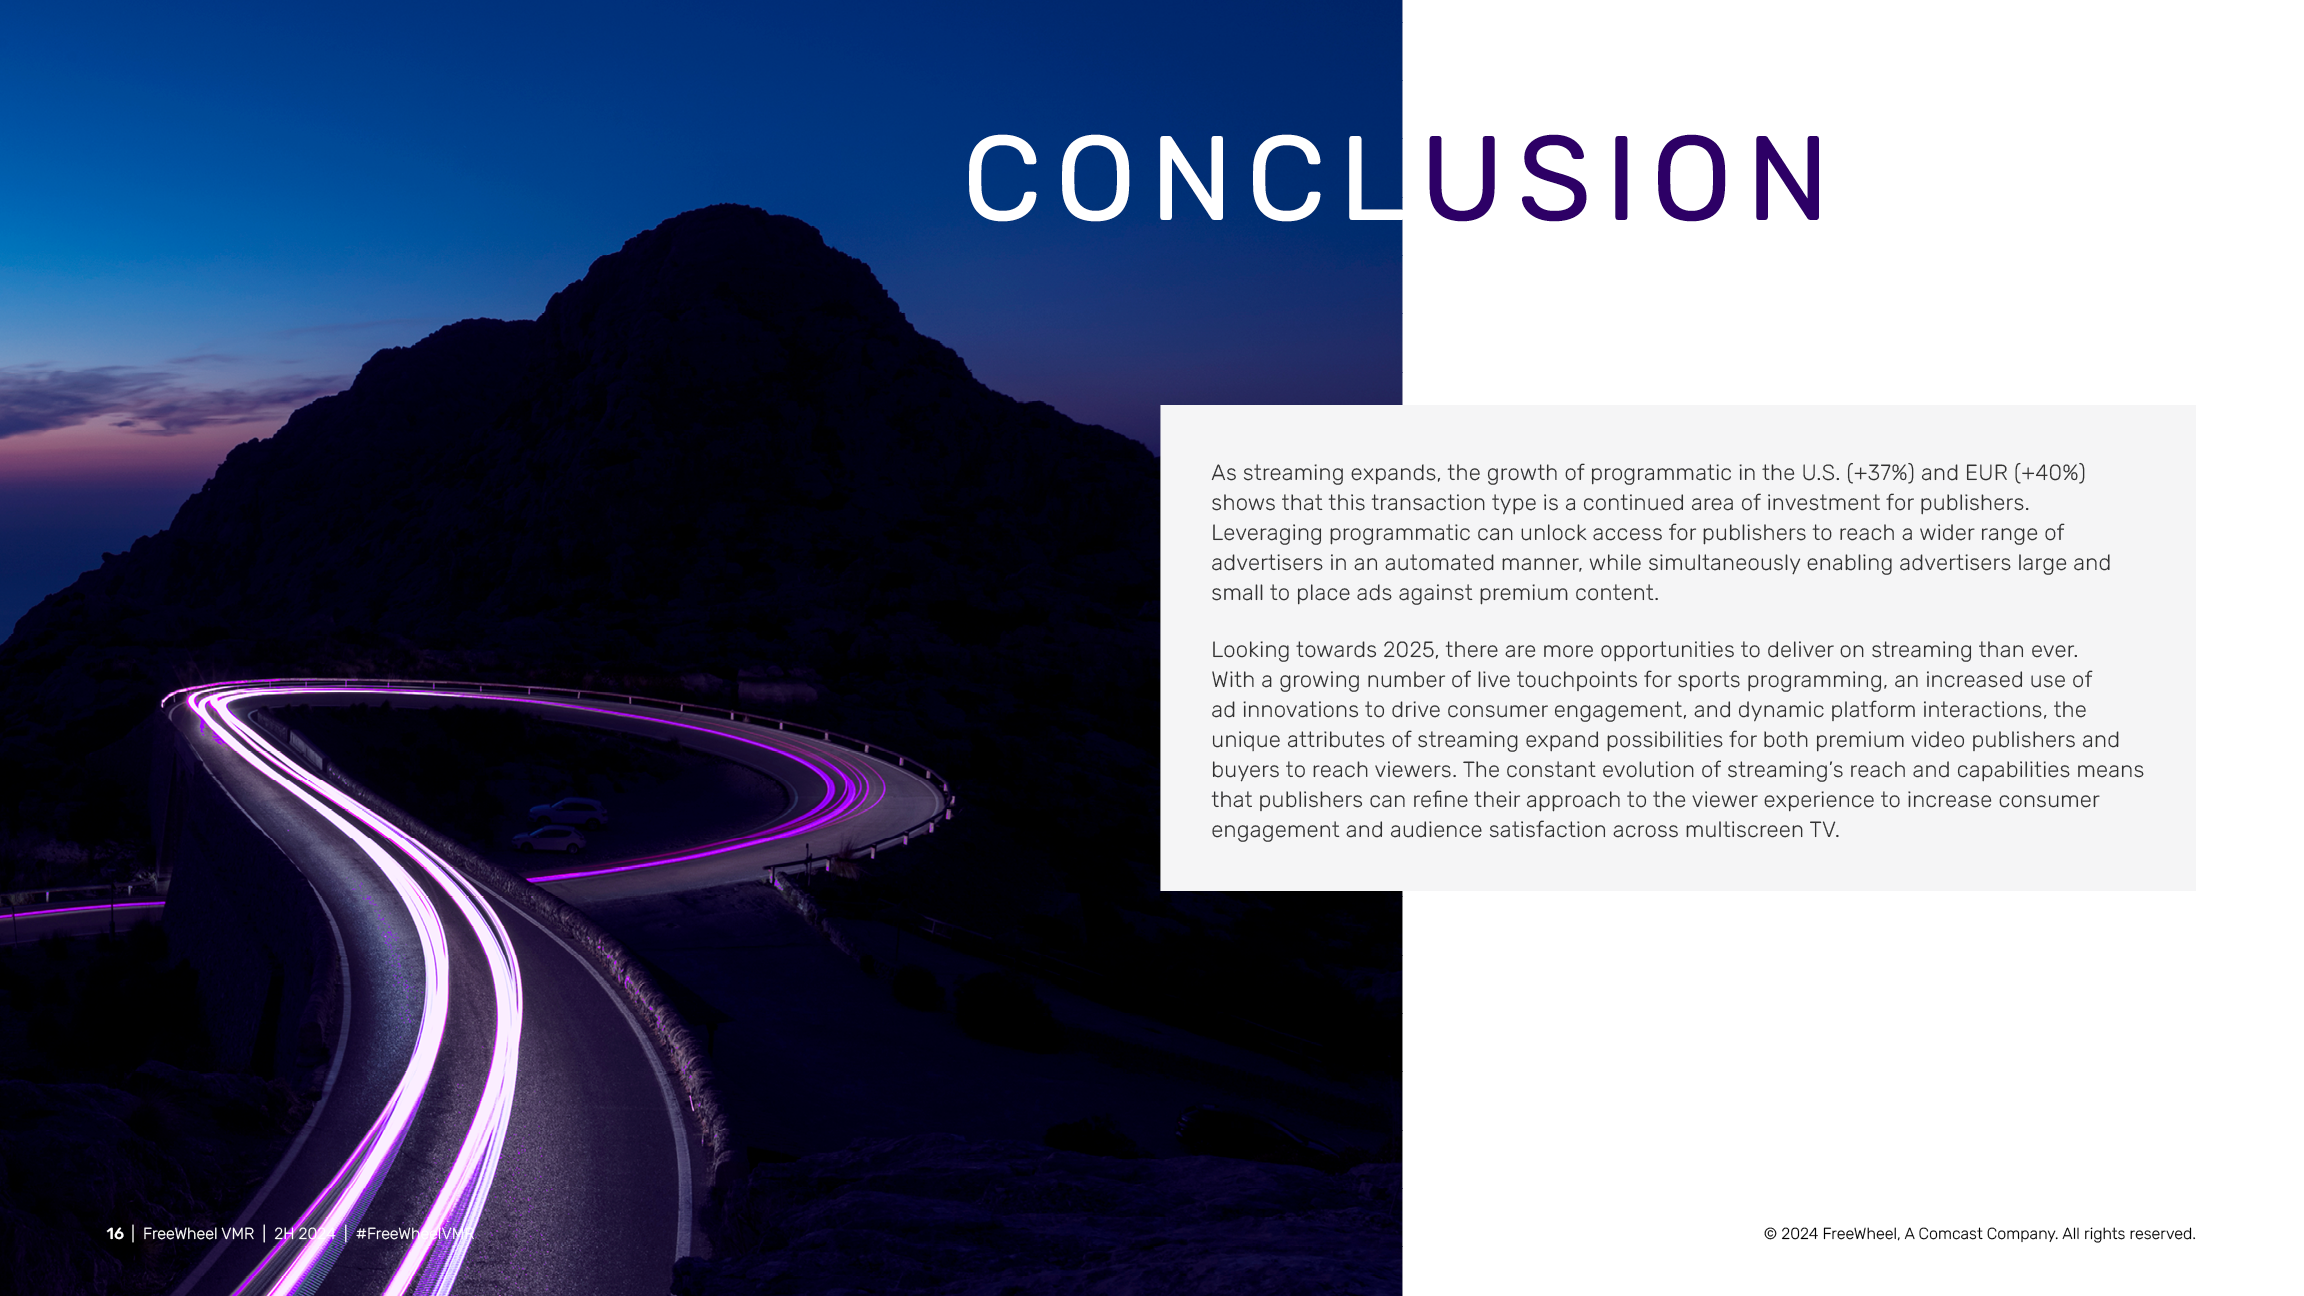
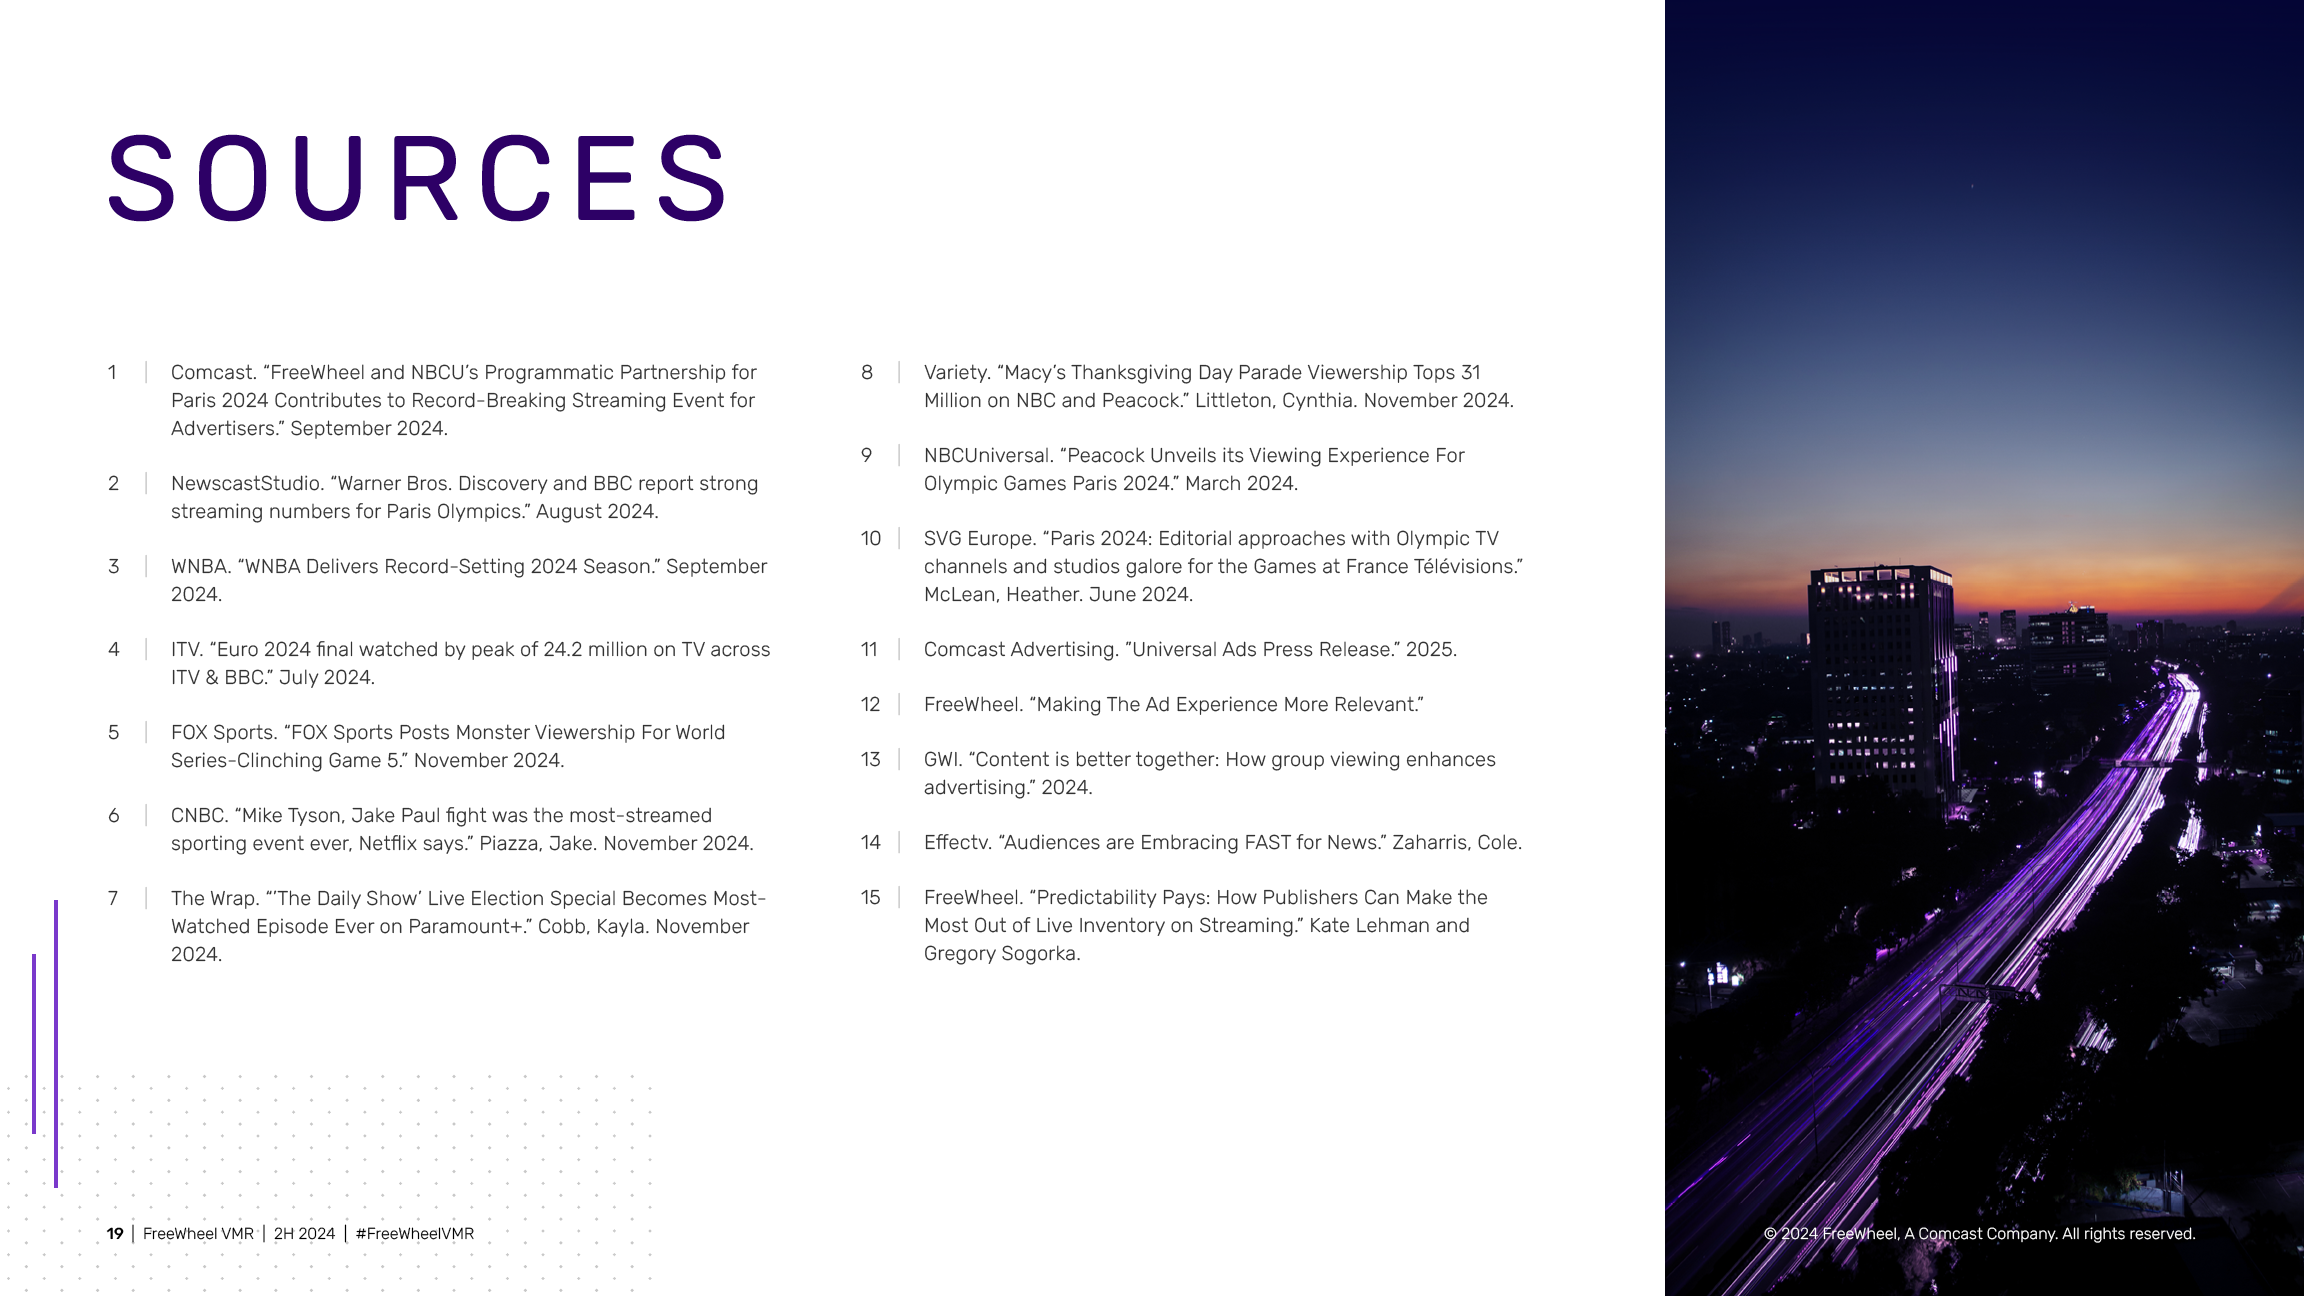
To breathe new life into an established design system, I focused on gathering a collection of imagery that not only speaks to the FreeWheel brand but also has a cohesive theme: a splash of light against a dark scene, with dynamic movement that nods to the big idea of “delivering on streaming,” moving forward, and evolving.
From abstract light paintings, to photos of winding mountain roads at sunset, to images of glowing screens illuminating a face, all of these visuals were meticulously manipulated in Photoshop and laid out via InDesign to help the reader digest the copy, data, and charts. The visual theme of everything ties the report together on a subconscious level.